Introduction to Service Telemetry Framework 1.5
Service Telemetry Framework (STF) collects monitoring data from OpenStack (OSP) or third-party nodes. You can use STF to perform the following tasks:
-
Store or archive the monitoring data for historical information.
-
View the monitoring data graphically on the dashboard.
-
Use the monitoring data to trigger alerts or warnings.
The monitoring data can be either metric or event:
- Metric
-
A numeric measurement of an application or system.
- Event
-
Irregular and discrete occurrences that happen in a system.
The components of STF use a message bus for data transport. Other modular components that receive and store data are deployed as containers on OpenShift.
Service Telemetry Framework architecture
Service Telemetry Framework (STF) uses a client-server architecture, in which OpenStack (OSP) is the client and OpenShift is the server.
By default, STF collects, transports, and stores metrics information.
You can collect OSP events data, transport it with the message bus, and forward it to a user-provided Elasticsearch from the Smart Gateways, but this option is deprecated.
STF consists of the following components:
-
Data collection
-
collectd: Collects infrastructure metrics and events on OSP.
-
Ceilometer: Collects OSP metrics and events on OSP.
-
-
Transport
-
Apache Qpid Dispatch Router: An AMQP 1.x compatible messaging bus that provides fast and reliable data transport to transfer the metrics from OSP to STF for storage or forwarding.
-
Smart Gateway: A Golang application that takes metrics and events from the AMQP 1.x bus to deliver to Prometheus or an external Elasticsearch.
-
-
Data storage
-
Prometheus: Time-series data storage that stores STF metrics received from the Smart Gateway.
-
Alertmanager: An alerting tool that uses Prometheus alert rules to manage alerts.
-
-
User provided components
-
Grafana: A visualization and analytics application that you can use to query, visualize, and explore data.
-
Elasticsearch: Events data storage that stores OSP events received and forwarded by the Smart Gateway.
-
The following table describes the application of the client and server components:
| Component | Client | Server |
|---|---|---|
An AMQP 1.x compatible messaging bus |
yes |
yes |
Smart Gateway |
no |
yes |
Prometheus |
no |
yes |
Elasticsearch |
no |
yes |
Grafana |
no |
yes |
collectd |
yes |
no |
Ceilometer |
yes |
no |
| To ensure that the monitoring platform can report operational problems with your cloud, do not install STF on the same infrastructure that you are monitoring. |
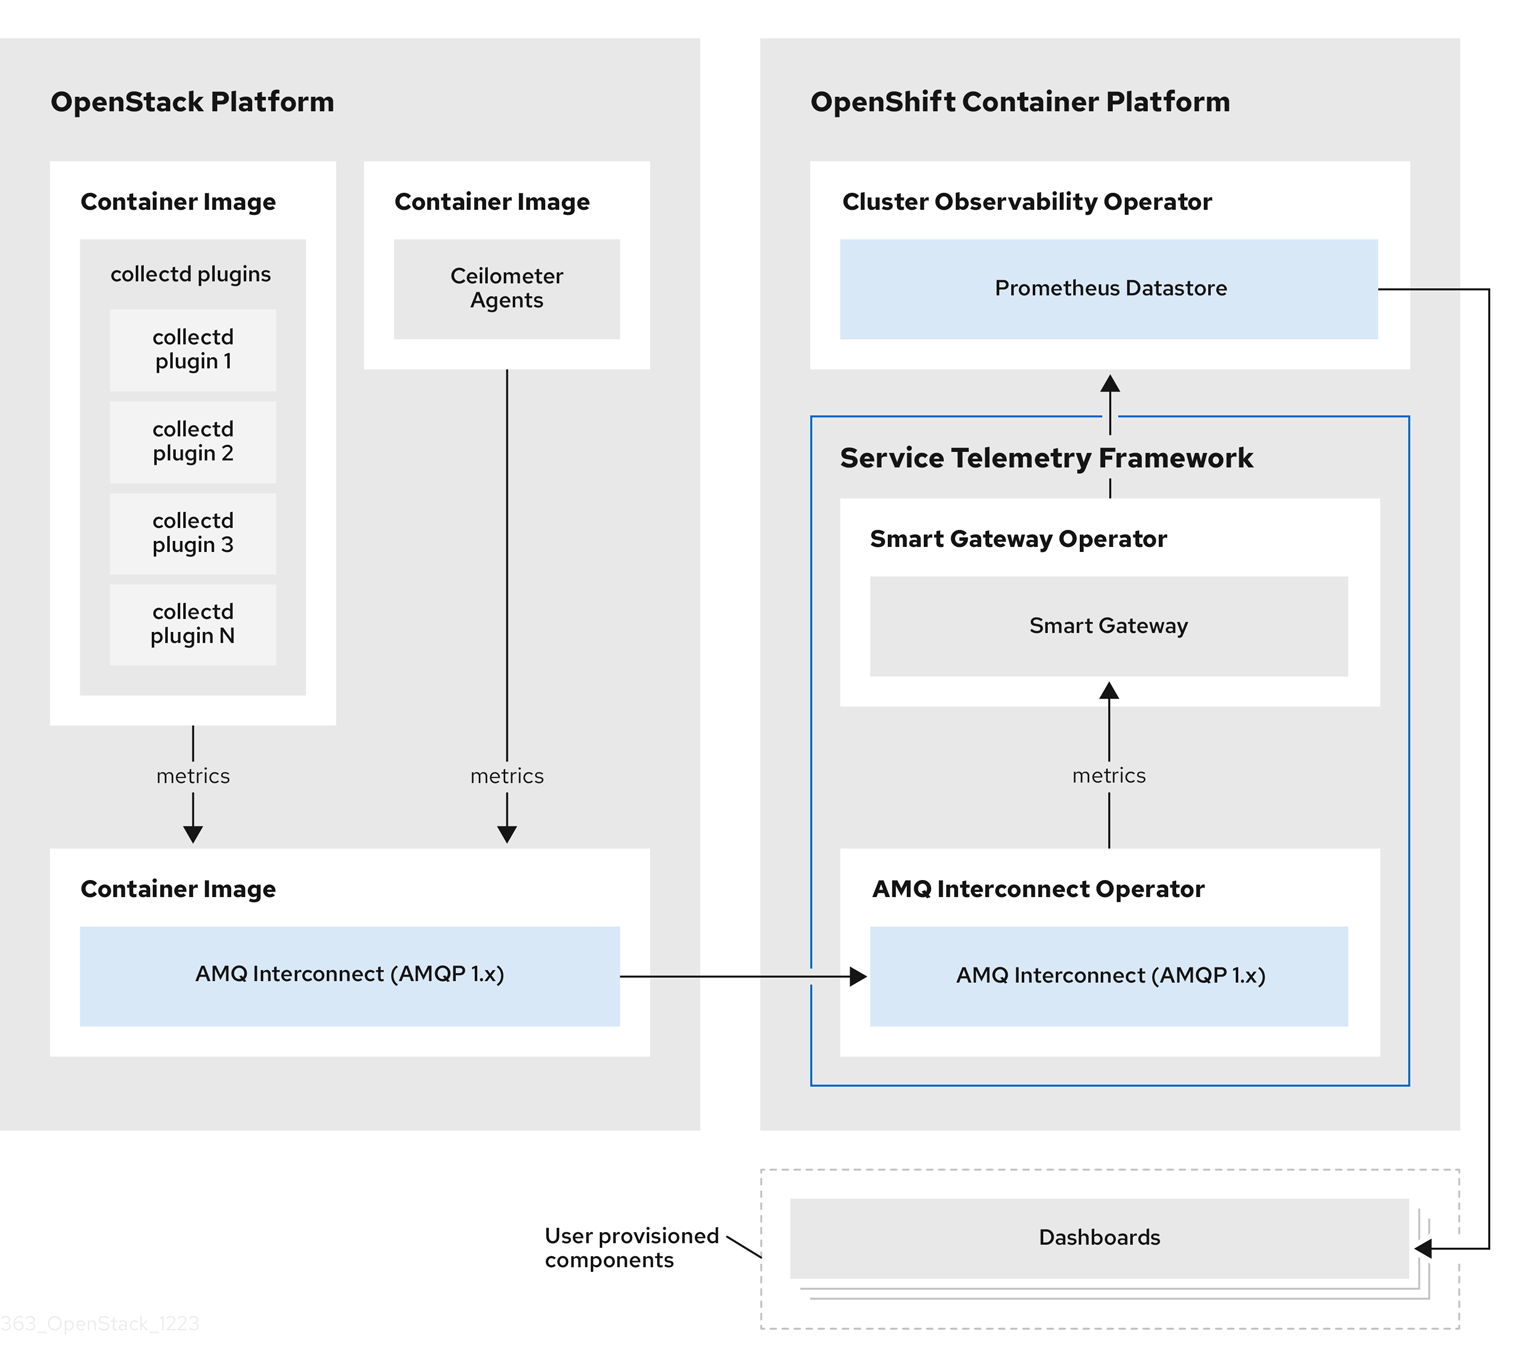
For client side metrics, collectd provides infrastructure metrics without project data, and Ceilometer provides OSP platform data based on projects or user workload. Both Ceilometer and collectd deliver data to Prometheus by using the Apache Qpid Dispatch Router transport, delivering the data through the message bus. On the server side, a Golang application called the Smart Gateway takes the data stream from the bus and exposes it as a local scrape endpoint for Prometheus.
When you collect and store events, collectd and Ceilometer deliver event data to the server side by using the Apache Qpid Dispatch Router transport. Another Smart Gateway forwards the data to a user-provided Elasticsearch datastore.
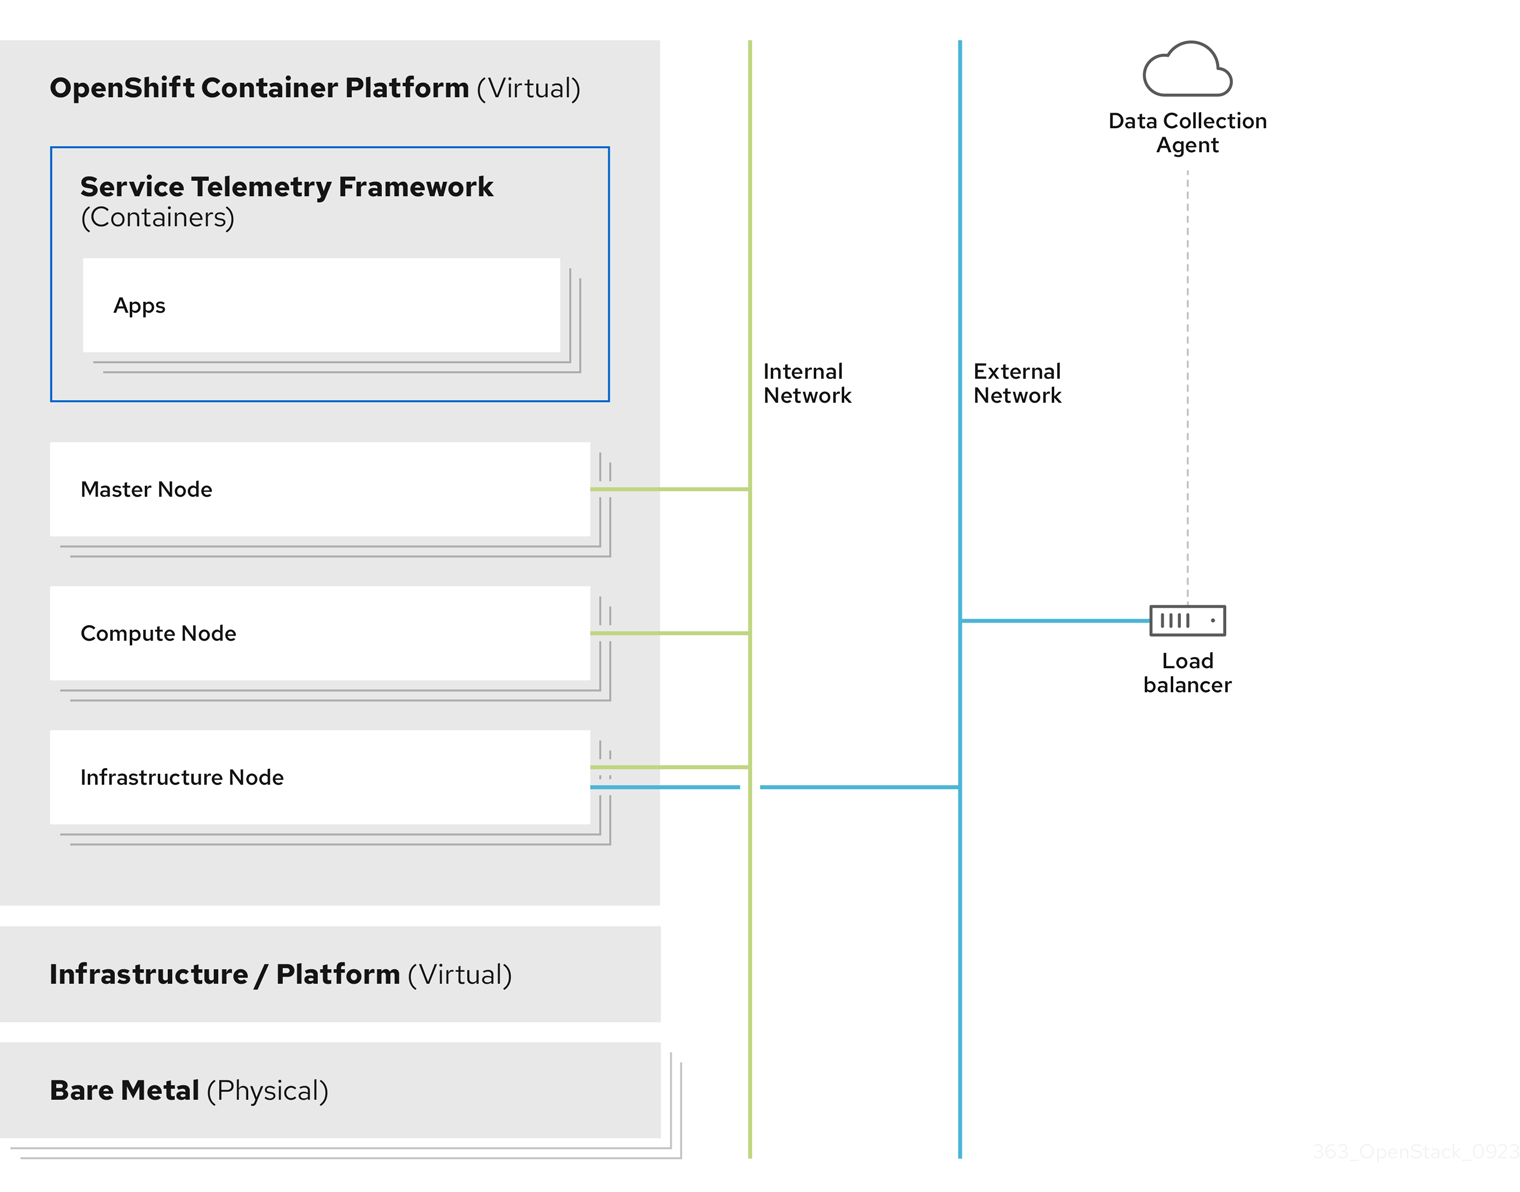
Server-side STF monitoring infrastructure consists of the following layers:
-
Service Telemetry Framework 1.5
-
OpenShift Extended Update Support (EUS) releases 4.18 and 4.20
-
Infrastructure platform
For more information about the OpenShift EUS releases, see Red Hat OpenShift Container Platform Life Cycle Policy.
STF Architecture Changes
In releases of STF prior to 1.5.3, the Service Telemetry Operator requested instances of Elasticsearch from the Elastic Cloud on Kubernetes (ECK) Operator. STF now uses a forwarding model, where events are forwarded from a Smart Gateway instance to a user-provided instance of Elasticsearch.
|
The management of an Elasticsearch instances by Service Telemetry Operator is deprecated. |
In new ServiceTelemetry deployments, the observabilityStrategy parameter has a value of use_redhat, that does not request Elasticsearch instances from ECK. Deployments of ServiceTelemetry with STF version 1.5.2 or older and were updated to 1.5.3 will have the observabilityStrategy parameter set to use_community, which matches the previous architecture.
If a user previously deployed an Elasticsearch instance with STF, the Service Telemetry Operator updates the ServiceTelemetry custom resource object to have the observabilityStrategy parameter set to use_community, and functions similar to previous releases. For more information about observability strategies, see Observability Strategy in Service Telemetry Framework.
It is recommended that users of STF migrate to the use_redhat observability strategy. For more information about migration to the use_redhat observability strategy, see the Red Hat Knowledge Base article Migrating Service Telemetry Framework to fully supported operators.
Installation size of OpenShift
The size of your OpenShift installation depends on the following factors:
-
The infrastructure that you select.
-
The number of nodes that you want to monitor.
-
The number of metrics that you want to collect.
-
The resolution of metrics.
-
The length of time that you want to store the data.
Installation of Service Telemetry Framework (STF) depends on an existing OpenShift environment.
For more information about minimum resources requirements when you install OpenShift on baremetal, see Minimum resource requirements in the Installing a cluster on bare metal guide. For installation requirements of the various public and private cloud platforms that you can install, see the corresponding installation documentation for your cloud platform of choice.
Development environment resource requirements
You can create an all-in-one development environment for STF locally by using CodeReady Containers. The installation process of CodeReady Containers (CRC) is available at https://code-ready.github.io/crc/#installation_gsg.
Deployment of OpenShift 4.18 is required for STF. The compatible version of CRC is 2.19.0, available at https://developers.redhat.com/content-gateway/rest/mirror/pub/openshift-v4/clients/crc/2.19.0/
The minimum resource requirements for CRC is not enough by default to run STF. Ensure that your host system has the following resources available:
-
4 physical cores (8 hyperthreaded cores)
-
64 GB of memory
-
80 GB of storage space
-
If you have an existing environment, delete it, and recreate it to ensure that the resource requests have an effect. Enter the
crc deletecommand:crc delete -
Use the
crc startcommand to start your environment. The recommended minimum system resources for running STF in CRC is 48 GB of memory and 8 virtual CPU cores:crc start --memory=49152 --cpus=8
Preparing your OpenShift environment for Service Telemetry Framework
To prepare your OpenShift environment for Service Telemetry Framework (STF), you must plan for persistent storage, adequate resources, event storage, and network considerations:
-
Ensure that you have persistent storage available in your OpenShift cluster for a production-grade deployment. For more information, see Persistent volumes.
-
Ensure that enough resources are available to run the Operators and the application containers. For more information, see Resource allocation.
Observability Strategy in Service Telemetry Framework
Service Telemetry Framework (STF) does not include event storage backends or dashboarding tools. STF can optionally create datasource configurations for Grafana using the community operator to provide a dashboarding interface.
Instead of having Service Telemetry Operator create custom resource requests, you can use your own deployments of these applications or other compatible applications, and scrape the metrics Smart Gateways for delivery to your own Prometheus-compatible system for telemetry storage. If you set the observabilityStrategy to none, then storage backends will not be deployed so persistent storage will not be required by STF.
Use the observabilityStrategy property on the STF object to specify which type of observability components will be deployed.
The following values are available:
| value | meaning |
|---|---|
use_redhat |
Red Hat supported components are requested by STF. This includes Prometheus and Alertmanager from the Observability Operator, but no resource requests to Elastic Cloud on Kubernetes (ECK) Operator. If enabled, resources are also requested from the Grafana Operator (community component). |
use_hybrid |
In addition to the Red Hat supported components, Elasticsearch and Grafana resources are also requested (if specified in the ServiceTelemetry object) |
use_community |
The community version of Prometheus Operator is used instead of Observability Operator. Elasticsearch and Grafana resources are also requested (if specified in the ServiceTelemetry object) |
none |
No storage or alerting components are deployed |
|
Newly deployed STF environments as of 1.5.3 default to |
To migrate an existing STF deployment to use_redhat, see the Red Hat Knowledge Base article Migrating Service Telemetry Framework to fully supported operators.
Persistent volumes
Service Telemetry Framework (STF) uses persistent storage in OpenShift to request persistent volumes so that Prometheus can store metrics.
When you enable persistent storage through the Service Telemetry Operator, the Persistent Volume Claims (PVC) requested in an STF deployment results in an access mode of RWO (ReadWriteOnce). If your environment contains pre-provisioned persistent volumes, ensure that volumes of RWO are available in the OpenShift default configured storageClass.
-
For more information about configuring persistent storage for OpenShift, see Understanding persistent storage.
-
For more information about recommended configurable storage technology in OpenShift, see Recommended configurable storage technology.
-
For more information about configuring persistent storage for Prometheus in STF, see Configuring persistent storage for Prometheus.
Resource allocation
To enable the scheduling of pods within the OpenShift infrastructure, you need resources for the components that are running. If you do not allocate enough resources, pods remain in a Pending state because they cannot be scheduled.
The amount of resources that you require to run Service Telemetry Framework (STF) depends on your environment and the number of nodes and clouds that you want to monitor.
-
For recommendations about sizing for metrics collection, see the Red Hat Knowledge Base article Service Telemetry Framework Performance and Scaling.
Network considerations for Service Telemetry Framework
You can deploy Service Telemetry Framework (STF) in fully connected network environments or in OpenShift-disconnected environments. You cannot deploy STF in network proxy environments.
Deploying STF on OpenShift-disconnected environments
Since Service Telemetry Framework (STF) version 1.5.4, you can deploy STF in OpenShift-disconnected environments.
-
OpenShift Extended Update Support (EUS) version 4.18 or 4.20 deployed in a restricted network.
-
A mirror registry so that the OpenShift cluster can access the required images. For more information about mirror registries, see Disconnected installation mirroring in the OpenShift Installing guide.
-
All the STF dependencies are available in the OpenShift cluster mirror registry.
You can use the oc-mirror plugin to fetch the STF dependencies and add them to the OpenShift cluster mirror registry. For more information about installing the oc-mirror plugin, see Mirroring images for a disconnected installation using the oc-mirror plugin in the OpenShift Installing guide.
-
Create an
imagesetconfig.yamlfile in your local working directory:imagesetconfig.yamlapiVersion: mirror.openshift.io/v1alpha2 kind: ImageSetConfiguration storageConfig: local: path: ./ mirror: operators: - catalog: registry.redhat.io/redhat/redhat-operator-index:v4.14 packages: - name: service-telemetry-operator channels: - name: stable-1.5 - name: openshift-cert-manager-operator channels: - name: stable-v1 - name: amq7-interconnect-operator channels: - name: 1.10.x - name: smart-gateway-operator channels: - name: stable-1.5 - name: cluster-observability-operator channels: - name: stable -
(Optional) If your mirror registry is not reachable, you can save the manifests and images that you fetched with
oc-mirrorand physically transfer them to the mirror registry and OpenShift cluster. Otherwise you can runoc-mirrorand point to the mirror registry.You can use the
oc-mirrorplugin differently, depending on your environment, such as:-
mirroring between mirrors.
-
mirror from mirror to disk.
-
mirror from disk to mirror.
For more information about different
oc-mirrorscenarios, see Mirroring an image set in a fully disconnected environment in the OpenShift Installing guide.
-
-
Push the STF operators and their dependencies from the mirror registry and generate the manifest for the OpenShift cluster.
$ oc-mirror --config imagesetconfig.yaml <mirror_registry_location>-
Replace <mirror_registry_location> with the filepath to the mirror registry that you want to use.
-
-
Locate the generated manifests and apply them to the target OpenShift cluster. For more information, see Configuring your cluster to use the resources generated by oc-mirror in the OpenShift Installing guide.
The manifests that you generate with oc-mirrorproduce catalogs with the full index name, such asredhat-operator-indexinstead ofredhat-operatorsforCatalogSource. Ensure that you use the correct index name for the STF subscriptions. For more information, see Deploying Service Telemetry Framework to the OpenShift environment. For more information about customizing Operators with oc mirror, see the Red Hat Knowledgebase solution How to customize the catalog name and tags of Operators mirrored to the mirror registry using the oc mirror plugin.
-
Check that the catalog sources are applied. You can return the entries for new catalogs that reference the STF operators and their dependencies:
$ oc get catalogsources -
You have deployed STF in a disconnected OpenShift cluster and therefore cannot access external networks.
Installing the core components of Service Telemetry Framework
You can use Operators to load the Service Telemetry Framework (STF) components and objects. Operators manage each of the following STF core components:
-
Certificate Management
-
Apache Qpid Dispatch Router
-
Smart Gateways
-
Prometheus and Alertmanager
Service Telemetry Framework (STF) uses other supporting Operators as part of the deployment. STF can resolve most dependencies automatically, but you need to pre-install some Operators, such as Observability Operator, which provides an instance of Prometheus and Alertmanager, and cert-manager for Red Hat OpenShift, which provides management of certificates.
-
An OpenShift Extended Update Support (EUS) release version 4.18 or 4.20 is running.
-
You have prepared your OpenShift environment and ensured that there is persistent storage and enough resources to run the STF components on top of the OpenShift environment. For more information about STF performance, see the Red Hat Knowledge Base article Service Telemetry Framework Performance and Scaling.
-
You have deployed STF in a fully connected or OpenShift-disconnected environments. STF is unavailable in network proxy environments.
-
For more information about Operators, see the Understanding Operators guide.
-
For more information about Operator catalogs, see Red Hat-provided Operator catalogs.
-
For more information about the cert-manager Operator for Red Hat, see cert-manager Operator for Red Hat OpenShift overview.
-
For more information about Observability Operator, see Cluster Observability Operator Overview.
-
For more information about OpenShift life cycle policy and Extended Update Support (EUS), see Red Hat OpenShift Container Platform Life Cycle Policy.
Deploying Service Telemetry Framework to the OpenShift environment
Deploy Service Telemetry Framework (STF) to collect and store OpenStack (OSP) telemetry.
Deploying Observability Operator
You must install the Cluster Observability Operator (COO) before you create an instance of Service Telemetry Framework (STF) if the observabilityStrategy is set to use_redhat and the backends.metrics.prometheus.enabled is set to true in the ServiceTelemetry object. For more information about COO, see Cluster Observability Operator overview in the OpenShift Container Platform Documentation.
-
Log in to your OpenShift environment where STF is hosted.
-
To store metrics in Prometheus, enable the Observability Operator by using the
redhat-operatorsCatalogSource:$ oc create -f - <<EOF apiVersion: operators.coreos.com/v1alpha1 kind: Subscription metadata: name: cluster-observability-operator namespace: openshift-operators spec: channel: stable installPlanApproval: Automatic name: cluster-observability-operator source: redhat-operators sourceNamespace: openshift-marketplace EOF -
Verify that the
ClusterServiceVersionfor Observability Operator has a status ofSucceeded:$ oc wait --for jsonpath="{.status.phase}"=Succeeded csv --namespace=openshift-operators -l operators.coreos.com/cluster-observability-operator.openshift-operators clusterserviceversion.operators.coreos.com/observability-operator.v0.0.26 condition met
Deploying cert-manager for Red Hat OpenShift
The cert-manager for Red Hat OpenShift (cert-manager) Operator must be pre-installed before creating an instance of Service Telemetry Framework (STF). For more information about cert-manager, see cert-manager for Red Hat OpenShift overview.
In previous versions of STF, the only available cert-manager channel was tech-preview which is available until OpenShift v4.12. Installations of cert-manager on versions of OpenShift v4.14 and later must be installed from the stable-v1 channel. For new installations of STF it is recommended to install cert-manager from the stable-v1 channel.
| Only one deployment of cert-manager can be installed per OpenShift cluster. Subscribing to cert-manager in more than one project causes the deployments to conflict with each other. |
-
Log in to your OpenShift environment where STF is hosted.
-
Verify cert-manager is not already installed on the OpenShift cluster. If any results are returned, do not install another instance of cert-manager:
$ oc get sub --all-namespaces -o json | jq '.items[] | select(.metadata.name | match("cert-manager")) | .metadata.name' -
Create a namespace for the cert-manager Operator:
$ oc create -f - <<EOF apiVersion: project.openshift.io/v1 kind: Project metadata: name: cert-manager-operator spec: finalizers: - kubernetes EOF -
Create an OperatorGroup for the cert-manager Operator:
$ oc create -f - <<EOF apiVersion: operators.coreos.com/v1 kind: OperatorGroup metadata: name: cert-manager-operator namespace: cert-manager-operator spec: targetNamespaces: - cert-manager-operator upgradeStrategy: Default EOF -
Subscribe to the cert-manager Operator by using the redhat-operators CatalogSource:
$ oc create -f - <<EOF apiVersion: operators.coreos.com/v1alpha1 kind: Subscription metadata: name: openshift-cert-manager-operator namespace: cert-manager-operator labels: operators.coreos.com/openshift-cert-manager-operator.cert-manager-operator: "" spec: channel: stable-v1 installPlanApproval: Automatic name: openshift-cert-manager-operator source: redhat-operators sourceNamespace: openshift-marketplace EOF -
Validate your ClusterServiceVersion. Ensure that cert-manager Operator displays a phase of
Succeeded:oc wait --for jsonpath="{.status.phase}"=Succeeded csv --namespace=cert-manager-operator --selector=operators.coreos.com/openshift-cert-manager-operator.cert-manager-operator clusterserviceversion.operators.coreos.com/cert-manager-operator.v1.12.1 condition met
Deploying Service Telemetry Operator
Deploy Service Telemetry Operator on OpenShift to provide the supporting Operators and interface for creating an instance of Service Telemetry Framework (STF) to monitor OpenStack (OSP) cloud platforms.
-
You have installed Observability Operator to allow storage of metrics. For more information, see Deploying Observability Operator.
-
You have installed cert-manager for Red Hat OpenShift to allow certificate management. For more information, see Deploying cert-manager for Red Hat OpenShift.
-
Create a namespace to contain the STF components, for example,
service-telemetry:$ oc new-project service-telemetry -
Create an OperatorGroup in the namespace so that you can schedule the Operator pods:
$ oc create -f - <<EOF
apiVersion: operators.coreos.com/v1
kind: OperatorGroup
metadata:
  name: service-telemetry-operator-group
  namespace: service-telemetry
spec:
  targetNamespaces:
  - service-telemetry
EOF
For more information, see OperatorGroups.
-
Before you deploy STF on OpenShift, you must enable the catalog source. Install a CatalogSource that contains the Service Telemetry Operator and the Smart Gateway Operator:
$ oc create -f - <<EOF apiVersion: operators.coreos.com/v1alpha1 kind: CatalogSource metadata: name: infrawatch-operators namespace: openshift-marketplace spec: displayName: InfraWatch Operators image: quay.io/infrawatch-operators/infrawatch-catalog:nightly priority: 0 publisher: InfraWatch sourceType: grpc updateStrategy: registryPoll: interval: 30m EOF -
Confirm that the CatalogSource is installed:
$ oc get -nopenshift-marketplace catalogsource infrawatch-operators NAME DISPLAY TYPE PUBLISHER AGE infrawatch-operators InfraWatch Operators grpc InfraWatch 2m16s -
Validate that the Operators are available from the catalog:
$ oc get packagemanifests | grep InfraWatch service-telemetry-operator InfraWatch Operators 7m20s smart-gateway-operator InfraWatch Operators 7m20s -
Create the Service Telemetry Operator subscription to manage the STF instances:
$ oc create -f - <<EOF apiVersion: operators.coreos.com/v1alpha1 kind: Subscription metadata: name: service-telemetry-operator namespace: service-telemetry spec: channel: unstable installPlanApproval: Automatic name: service-telemetry-operator source: infrawatch-operators sourceNamespace: openshift-marketplace EOF -
Validate the Service Telemetry Operator and the dependent operators have their phase as Succeeded:
$ oc wait --for jsonpath="{.status.phase}"=Succeeded csv --namespace=service-telemetry -l operators.coreos.com/service-telemetry-operator.service-telemetry ; oc get csv --namespace service-telemetry

clusterserviceversion.operators.coreos.com/service-telemetry-operator.v1.5.1700688542 condition met

NAME                                         DISPLAY                                  VERSION          REPLACES                             PHASE
amq7-interconnect-operator.v1.10.17          Red Hat Integration - AMQ Interconnect   1.10.17          amq7-interconnect-operator.v1.10.4   Succeeded
observability-operator.v0.0.26               Cluster Observability Operator           0.1.0                                                 Succeeded
service-telemetry-operator.v1.5.1700688542   Service Telemetry Operator               1.5.1700688542                                        Succeeded
smart-gateway-operator.v5.0.1700688539       Smart Gateway Operator                   5.0.1700688539                                        Succeeded
Creating a ServiceTelemetry object in OpenShift
Create a ServiceTelemetry object in OpenShift to result in the Service Telemetry Operator creating the supporting components for a Service Telemetry Framework (STF) deployment. For more information, see Primary parameters of the ServiceTelemetry object.
-
You have deployed STF and the supporting operators. For more information, see Deploying Service Telemetry Framework to the OpenShift environment.
-
You have installed Observability Operator to allow storage of metrics. For more information, see Deploying Observability Operator.
-
You have installed cert-manager for Red Hat OpenShift to allow certificate management. For more information, see Deploying cert-manager for Red Hat OpenShift.
-
Log in to your OpenShift environment where STF is hosted.
-
To deploy STF that results in the core components for metrics delivery being configured, create a
ServiceTelemetryobject:$ oc apply -f - <<EOF apiVersion: infra.watch/v1beta1 kind: ServiceTelemetry metadata: name: default namespace: service-telemetry spec: alerting: alertmanager: storage: persistent: pvcStorageRequest: 20G strategy: persistent enabled: true backends: metrics: prometheus: enabled: true scrapeInterval: 30s storage: persistent: pvcStorageRequest: 20G retention: 24h strategy: persistent clouds: - metrics: collectors: - bridge: ringBufferCount: 15000 ringBufferSize: 16384 verbose: false collectorType: collectd debugEnabled: false subscriptionAddress: collectd/cloud1-telemetry - bridge: ringBufferCount: 15000 ringBufferSize: 16384 verbose: false collectorType: ceilometer debugEnabled: false subscriptionAddress: anycast/ceilometer/cloud1-metering.sample - bridge: ringBufferCount: 15000 ringBufferSize: 65535 verbose: false collectorType: sensubility debugEnabled: false subscriptionAddress: sensubility/cloud1-telemetry name: cloud1 observabilityStrategy: use_redhat transports: qdr: auth: basic certificates: caCertDuration: 70080h endpointCertDuration: 70080h enabled: true web: enabled: false EOFTo override these defaults, add the configuration to the
specparameter. -
View the STF deployment logs in the Service Telemetry Operator:
$ oc logs --selector name=service-telemetry-operator

...
--------------------------- Ansible Task Status Event StdOut  -----------------

PLAY RECAP *********************************************************************
localhost                  : ok=90   changed=0    unreachable=0    failed=0    skipped=26   rescued=0    ignored=0
-
To determine that all workloads are operating correctly, view the pods and the status of each pod.
$ oc get pods

NAME                                                        READY   STATUS    RESTARTS   AGE
alertmanager-default-0                                      3/3     Running   0          123m
default-cloud1-ceil-meter-smartgateway-7dfb95fcb6-bs6jl     3/3     Running   0          122m
default-cloud1-coll-meter-smartgateway-674d88d8fc-858jk     3/3     Running   0          122m
default-cloud1-sens-meter-smartgateway-9b869695d-xcssf      3/3     Running   0          122m
default-interconnect-6cbf65d797-hk7l6                       1/1     Running   0          123m
interconnect-operator-7bb99c5ff4-l6xc2                      1/1     Running   0          138m
prometheus-default-0                                        3/3     Running   0          122m
service-telemetry-operator-7966cf57f-g4tx4                  1/1     Running   0          138m
smart-gateway-operator-7d557cb7b7-9ppls                     1/1     Running   0          138m
Primary parameters of the ServiceTelemetry object
You can set the following primary configuration parameters of the ServiceTelemetry object to configure your STF deployment:
-
alerting -
backends -
clouds -
graphing -
highAvailability -
transports
The backends parameter
Set the value of the backends parameter to allocate the storage back ends for metrics and events, and to enable the Smart Gateways that the clouds parameter defines. For more information, see The clouds parameter.
You can use Prometheus as the metrics storage back end and Elasticsearch as the events storage back end. The Service Telemetry Operator can create custom resource objects that the Prometheus Operator watches to create a Prometheus workload. You need an external deployment of Elasticsearch to store events.
Enabling Prometheus as a storage back end for metrics
To enable Prometheus as a storage back end for metrics, you must configure the ServiceTelemetry object.
-
Edit the
ServiceTelemetryobject:$ oc edit stf default -
Set the value of the backends.metrics.prometheus.enabled parameter to
true:apiVersion: infra.watch/v1beta1 kind: ServiceTelemetry metadata: name: default namespace: service-telemetry spec: [...] backends: metrics: prometheus: enabled: true
Configuring persistent storage for Prometheus
Set the additional parameters in backends.metrics.prometheus.storage.persistent to configure persistent storage options for Prometheus, such as storage class and volume size.
Define the back end storage class with the storageClass parameter. If you do not set this parameter, the Service Telemetry Operator uses the default storage class for the OpenShift cluster.
Define the minimum required volume size for the storage request with the pvcStorageRequest parameter. By default, Service Telemetry Operator requests a volume size of 20G (20 Gigabytes).
-
List the available storage classes:
$ oc get storageclasses NAME PROVISIONER RECLAIMPOLICY VOLUMEBINDINGMODE ALLOWVOLUMEEXPANSION AGE csi-manila-ceph manila.csi.openstack.org Delete Immediate false 20h standard (default) kubernetes.io/cinder Delete WaitForFirstConsumer true 20h standard-csi cinder.csi.openstack.org Delete WaitForFirstConsumer true 20h -
Edit the
ServiceTelemetryobject:$ oc edit stf default -
Set the value of the
backends.metrics.prometheus.enabledparameter totrueand the value ofbackends.metrics.prometheus.storage.strategytopersistent:apiVersion: infra.watch/v1beta1 kind: ServiceTelemetry metadata: name: default namespace: service-telemetry spec: [...] backends: metrics: prometheus: enabled: true storage: strategy: persistent persistent: storageClass: standard-csi pvcStorageRequest: 50G
Enabling Elasticsearch as a storage back end for events
|
Previous versions of STF managed Elasticsearch objects for the community supported Elastic Cloud on Kubernetes Operator (ECK). Elasticsearch management functionality is deprecated in STF 1.5.3. You can still forward to an existing Elasticsearch instance that you deploy and manage with ECK, but you cannot manage the creation of Elasticsearch objects. When you upgrade your STF deployment, existing Elasticsearch objects and deployments remain, but are no longer managed by STF. |
To enable events forwarding to Elasticsearch as a storage back end, you must configure the ServiceTelemetry object.
-
Edit the
ServiceTelemetryobject:$ oc edit stf default -
Set the value of the
backends.events.elasticsearch.enabledparameter totrueand configure thehostUrlwith the relevant Elasticsearch instance:apiVersion: infra.watch/v1beta1 kind: ServiceTelemetry metadata: name: default namespace: service-telemetry spec: [...] backends: events: elasticsearch: enabled: true forwarding: hostUrl: https://external-elastic-http.domain:9200 tlsServerName: "" tlsSecretName: elasticsearch-es-cert userSecretName: elasticsearch-es-elastic-user useBasicAuth: true useTls: true -
Create the secret named in the
userSecretNameparameter to store the basicauthcredentials$ oc create secret generic elasticsearch-es-elastic-user --from-literal=elastic='<PASSWORD>' -
Copy the CA certificate into a file named
EXTERNAL-ES-CA.pem, then create the secret named in thetlsSecretNameparameter to make it available to STF$ cat EXTERNAL-ES-CA.pem -----BEGIN CERTIFICATE----- [...] -----END CERTIFICATE----- $ oc create secret generic elasticsearch-es-cert --from-file=ca.crt=EXTERNAL-ES-CA.pem
The clouds parameter
Configure the clouds parameter to define which Smart Gateway objects deploy and provide the interface for monitored cloud environments to connect to an instance of STF. If a supporting back end is available, metrics and events Smart Gateways for the default cloud configuration are created. By default, the Service Telemetry Operator creates Smart Gateways for cloud1.
You can create a list of cloud objects to control which Smart Gateways are created for the defined clouds. Each cloud consists of data types and collectors. Data types are metrics or events. Each data type consists of a list of collectors, the message bus subscription address, and a parameter to enable debugging. Available collectors for metrics are collectd, ceilometer, and sensubility. Available collectors for events are collectd and ceilometer. Ensure that the subscription address for each of these collectors is unique for every cloud, data type, and collector combination.
The default cloud1 configuration is represented by the following ServiceTelemetry object, which provides subscriptions and data storage of metrics and events for collectd, Ceilometer, and Sensubility data collectors for a particular cloud instance:
apiVersion: infra.watch/v1beta1
kind: ServiceTelemetry
metadata:
  name: default
  namespace: service-telemetry
spec:
  clouds:
    - name: cloud1
      metrics:
        collectors:
          - collectorType: collectd
            subscriptionAddress: collectd/cloud1-telemetry
          - collectorType: ceilometer
            subscriptionAddress: anycast/ceilometer/cloud1-metering.sample
          - collectorType: sensubility
            subscriptionAddress: sensubility/cloud1-telemetry
            debugEnabled: false
      events:
        collectors:
          - collectorType: collectd
            subscriptionAddress: collectd/cloud1-notify
          - collectorType: ceilometer
            subscriptionAddress: anycast/ceilometer/cloud1-event.sample
Each item of the clouds parameter represents a cloud instance. A cloud instance consists of three top-level parameters: name, metrics, and events. The metrics and events parameters represent the corresponding back end for storage of that data type. The collectors parameter specifies a list of objects made up of two required parameters, collectorType and subscriptionAddress, and these represent an instance of the Smart Gateway. The collectorType parameter specifies data collected by either collectd, Ceilometer, or Sensubility. The subscriptionAddress parameter provides the Apache Qpid Dispatch Router address to which a Smart Gateway subscribes.
You can use the optional Boolean parameter debugEnabled within the collectors parameter to enable additional console debugging in the running Smart Gateway pod.
-
For more information about deleting default Smart Gateways, see Deleting the default Smart Gateways.
-
For more information about how to configure multiple clouds, see Configuring multiple clouds.
The alerting parameter
Set the alerting parameter to create an Alertmanager instance and a storage back end. By default, alerting is enabled. For more information, see Alerts in Service Telemetry Framework.
The graphing parameter
Set the graphing parameter to create a Grafana instance. By default, graphing is disabled. For more information, see Dashboards in Service Telemetry Framework.
The highAvailability parameter
|
STF high availability (HA) mode is deprecated and is not supported in production environments. OpenShift is a highly-available platform, and you can cause issues and complicate debugging in STF if you enable HA mode. |
Set the highAvailability parameter to instantiate multiple copies of STF components to reduce recovery time of components that fail or are rescheduled. By default, highAvailability is disabled. For more information, see High availability.
The transports parameter
Set the transports parameter to enable the message bus for a STF deployment. The only transport currently supported is Apache Qpid Dispatch Router. By default, the qdr transport is enabled.
Accessing user interfaces for STF components
In OpenShift, applications are exposed to the external network through a route. For more information about routes, see Configuring ingress cluster traffic.
In Service Telemetry Framework (STF), HTTPS routes are exposed for each service that has a web-based interface and protected by OpenShift role-based access control (RBAC).
You need the following permissions to access the corresponding component UI’s:
{"namespace":"service-telemetry", "resource":"grafanas", "group":"grafana.integreatly.org", "verb":"get"}
{"namespace":"service-telemetry", "resource":"prometheuses", "group":"monitoring.rhobs", "verb":"get"}
{"namespace":"service-telemetry", "resource":"alertmanagers", "group":"monitoring.rhobs", "verb":"get"}
For more information about RBAC, see Using RBAC to define and apply permissions.
-
Log in to OpenShift.
-
Change to the
service-telemetrynamespace:$ oc project service-telemetry -
List the available web UI routes in the
service-telemetryproject:$ oc get routes | grep web default-alertmanager-proxy default-alertmanager-proxy-service-telemetry.apps.infra.watch default-alertmanager-proxy web reencrypt/Redirect None default-prometheus-proxy default-prometheus-proxy-service-telemetry.apps.infra.watch default-prometheus-proxy web reencrypt/Redirect None -
In a web browser, navigate to https://<route_address>; to access the web interface for the corresponding service.
Configuring an alternate observability strategy
To skip the deployment of storage, visualization, and alerting backends, add observabilityStrategy: none to the ServiceTelemetry spec. In this mode, you only deploy Apache Qpid Dispatch Router routers and Smart Gateways, and you must configure an external Prometheus-compatible system to collect metrics from the STF Smart Gateways, and an external Elasticsearch to receive the forwarded events.
-
Create a
ServiceTelemetryobject with the propertyobservabilityStrategy: nonein thespecparameter. The manifest shows results in a default deployment of STF that is suitable for receiving telemetry from a single cloud with all metrics collector types.$ oc apply -f - <<EOF apiVersion: infra.watch/v1beta1 kind: ServiceTelemetry metadata: name: default namespace: service-telemetry spec: observabilityStrategy: none EOF -
Delete the remaining objects that are managed by community operators
$ for o in alertmanagers.monitoring.rhobs/default prometheuses.monitoring.rhobs/default elasticsearch/elasticsearch grafana/default-grafana; do oc delete $o; done -
To verify that all workloads are operating correctly, view the pods and the status of each pod:
$ oc get pods
NAME                                                      READY   STATUS    RESTARTS   AGE
default-cloud1-ceil-event-smartgateway-6f8547df6c-p2db5   3/3     Running   0          132m
default-cloud1-ceil-meter-smartgateway-59c845d65b-gzhcs   3/3     Running   0          132m
default-cloud1-coll-event-smartgateway-bf859f8d77-tzb66   3/3     Running   0          132m
default-cloud1-coll-meter-smartgateway-75bbd948b9-d5phm   3/3     Running   0          132m
default-cloud1-sens-meter-smartgateway-7fdbb57b6d-dh2g9   3/3     Running   0          132m
default-interconnect-668d5bbcd6-57b2l                     1/1     Running   0          132m
interconnect-operator-b8f5bb647-tlp5t                     1/1     Running   0          47h
service-telemetry-operator-566b9dd695-wkvjq               1/1     Running   0          156m
smart-gateway-operator-58d77dcf7-6xsq7                    1/1     Running   0          47h
-
For more information about configuring additional clouds or to change the set of supported collectors, see Deploying Smart Gateways.
-
To migrate an existing STF deployment to
use_redhat, see the Red Hat Knowledge Base article Migrating Service Telemetry Framework to fully supported operators.
Configuring OpenStack director for Service Telemetry Framework
To collect metrics, events, or both, and to send them to the Service Telemetry Framework (STF) storage domain, you must configure the OpenStack (OSP) overcloud to enable data collection and transport.
STF can support both single and multiple clouds. The default configuration in OSP and STF set up for a single cloud installation.
-
For a single OSP overcloud deployment with default configuration, see Deploying OpenStack overcloud for Service Telemetry Framework using director.
-
To plan your OSP installation and configuration STF for multiple clouds, see Configuring multiple clouds.
-
As part of an OSP overcloud deployment, you might need to configure additional features in your environment:
-
To disable the data collector services, see Disabling OpenStack services used with Service Telemetry Framework.
-
Deploying OpenStack overcloud for Service Telemetry Framework using director
As part of the OpenStack (OSP) overcloud deployment using director, you must configure the data collectors and the data transport to Service Telemetry Framework (STF).
-
For more information about deploying an OpenStack cloud using director, see Installing and managing Red Hat OpenStack Platform with director.
-
To collect data through Apache Qpid Dispatch Router, see the amqp1 plug-in.
Getting CA certificate from Service Telemetry Framework for overcloud configuration
To connect your OpenStack (OSP) overcloud to Service Telemetry Framework (STF), retrieve the CA certificate of Apache Qpid Dispatch Router that runs within STF and use the certificate in OSP configuration.
-
View a list of available certificates in STF:
$ oc get secrets -
Retrieve and note the content of the
default-interconnect-selfsignedSecret:$ oc get secret/default-interconnect-selfsigned -o jsonpath='{.data.ca\.crt}' | base64 -d
Retrieving the Apache Qpid Dispatch Router password
When you configure the OpenStack (OSP) overcloud for Service Telemetry Framework (STF), you must provide the Apache Qpid Dispatch Router password in the STF connection file.
You can disable basic authentication on the Apache Qpid Dispatch Router connection by setting the value of the transports.qdr.auth parameter of the ServiceTelemetry spec to none. The transports.qdr.auth parameter is absent in versions of STF before 1.5.3, so the default behavior is that basic authentication is disabled. In a new install of STF 1.5.3 or later, the default value of transports.qdr.auth is basic, but if you upgraded to STF 1.5.3, the default value of transports.qdr.auth is none.
-
Log in to your OpenShift environment where STF is hosted.
-
Change to the
service-telemetryproject:$ oc project service-telemetry -
Retrieve the Apache Qpid Dispatch Router password:
$ oc get secret default-interconnect-users -o json | jq -r .data.guest | base64 -d
Retrieving the Apache Qpid Dispatch Router route address
When you configure the OpenStack (OSP) overcloud for Service Telemetry Framework (STF), you must provide the Apache Qpid Dispatch Router route address in the STF connection file.
-
Log in to your OpenShift environment where STF is hosted.
-
Change to the
service-telemetryproject:$ oc project service-telemetry -
Retrieve the Apache Qpid Dispatch Router route address:
$ oc get routes -ogo-template='{{ range .items }}{{printf "%s\n" .spec.host }}{{ end }}' | grep "\-5671"
default-interconnect-5671-service-telemetry.apps.infra.watch
Creating the base configuration for STF
To configure the base parameters to provide a compatible data collection and transport for Service Telemetry Framework (STF), you must create a file that defines the default data collection values.
-
Log in to the undercloud host as the
stackuser. -
Create a configuration file called
enable-stf.yamlin the/home/stackdirectory.Setting
PipelinePublishersto an empty list results in no metric data passing to OSP telemetry components, such as Gnocchi or Panko. If you need to send data to additional pipelines, the Ceilometer polling interval of30seconds, that you specify inExtraConfig, might overwhelm the OSP telemetry components. You must increase the interval to a larger value, such as300, which results in less telemetry resolution in STF.enable-stf.yamlparameter_defaults: # only send to STF, not other publishers PipelinePublishers: [] # manage the polling and pipeline configuration files for Ceilometer agents ManagePolling: true ManagePipeline: true ManageEventPipeline: false # enable Ceilometer metrics CeilometerQdrPublishMetrics: true # enable collection of API status CollectdEnableSensubility: true CollectdSensubilityTransport: amqp1 # enable collection of containerized service metrics CollectdEnableLibpodstats: true # set collectd overrides for higher telemetry resolution and extra plugins # to load CollectdConnectionType: amqp1 CollectdAmqpInterval: 30 CollectdDefaultPollingInterval: 30 # to collect information about the virtual memory subsystem of the kernel # CollectdExtraPlugins: # - vmem # set standard prefixes for where metrics are published to QDR MetricsQdrAddresses: - prefix: 'collectd' distribution: multicast - prefix: 'anycast/ceilometer' distribution: multicast ExtraConfig: ceilometer::agent::polling::polling_interval: 30 ceilometer::agent::polling::polling_meters: - cpu - memory.usage # to avoid filling the memory buffers if disconnected from the message bus # note: this may need an adjustment if there are many metrics to be sent. collectd::plugin::amqp1::send_queue_limit: 5000 # to receive extra information about virtual memory, you must enable vmem plugin in CollectdExtraPlugins # collectd::plugin::vmem::verbose: true # provide name and uuid in addition to hostname for better correlation # to ceilometer data collectd::plugin::virt::hostname_format: "name uuid hostname" # to capture all extra_stats metrics, comment out below config collectd::plugin::virt::extra_stats: cpu_util vcpu disk # provide the human-friendly name of the virtual instance collectd::plugin::virt::plugin_instance_format: metadata # set memcached collectd plugin to report its metrics by hostname # rather than host IP, ensuring metrics in the dashboard remain uniform collectd::plugin::memcached::instances: local: host: "%{hiera('fqdn_canonical')}" port: 11211 # report root filesystem storage metrics collectd::plugin::df::ignoreselected: false
Configuring the STF connection for the overcloud
To configure the Service Telemetry Framework (STF) connection, you must create a file that contains the connection configuration of the Apache Qpid Dispatch Router for the overcloud to the STF deployment. Enable the collection of metrics and storage of the metrics in STF and deploy the overcloud. The default configuration is for a single cloud instance with the default message bus topics. For configuration of multiple cloud deployments, see Configuring multiple clouds.
-
Retrieve the CA certificate from the Apache Qpid Dispatch Router deployed by STF. For more information, see Getting CA certificate from Service Telemetry Framework for overcloud configuration.
-
Retrieve the Apache Qpid Dispatch Router password. For more information, see Retrieving the Apache Qpid Dispatch Router password.
-
Retrieve the Apache Qpid Dispatch Router route address. For more information, see Retrieving the Apache Qpid Dispatch Router route address.
-
Log in to the undercloud host as the
stackuser. -
Create a configuration file called
stf-connectors.yamlin the/home/stackdirectory. -
In the
stf-connectors.yamlfile, configure theMetricsQdrConnectorsaddress to connect the Apache Qpid Dispatch Router on the overcloud to the STF deployment. You configure the topic addresses for Sensubility, Ceilometer, and collectd in this file to match the defaults in STF. For more information about customizing topics and cloud configuration, see Configuring multiple clouds.stf-connectors.yamlresource_registry: OS::TripleO::Services::Collectd: /usr/share/openstack-tripleo-heat-templates/deployment/metrics/collectd-container-puppet.yaml parameter_defaults: ExtraConfig: qdr::router_id: "%{::hostname}.cloud1" MetricsQdrConnectors: - host: default-interconnect-5671-service-telemetry.apps.infra.watch port: 443 role: edge verifyHostname: false sslProfile: sslProfile saslUsername: guest@default-interconnect saslPassword: <password_from_stf> MetricsQdrSSLProfiles: - name: sslProfile caCertFileContent: | -----BEGIN CERTIFICATE----- <snip> -----END CERTIFICATE----- CeilometerQdrMetricsConfig: driver: amqp topic: cloud1-metering CollectdAmqpInstances: cloud1-telemetry: format: JSON presettle: false CollectdSensubilityResultsChannel: sensubility/cloud1-telemetry-
The
qdr::router_idconfiguration is to override the default value which uses the fully-qualified domain name (FQDN) of the host. In some cases the FQDN can result in a router ID length of greater than 61 characters which results in failed QDR connections. For deployments with shorter FQDN values this is not necessary. -
The
resource_registryconfiguration directly loads the collectd service because you do not include thecollectd-write-qdr.yamlenvironment file for multiple cloud deployments. -
Replace the
hostsub-parameter ofMetricsQdrConnectorswith the value that you retrieved in Retrieving the Apache Qpid Dispatch Router route address. -
Replace the
<password_from_stf>portion of thesaslPasswordsub-parameter ofMetricsQdrConnectorswith the value you retrieved in Retrieving the Apache Qpid Dispatch Router password. -
Replace the
caCertFileContentparameter with the contents retrieved in Getting CA certificate from Service Telemetry Framework for overcloud configuration. -
Set
topicvalue ofCeilometerQdrMetricsConfig.topicto define the topic for Ceilometer metrics. The value is a unique topic identifier for the cloud such ascloud1-metering. -
Set
CollectdAmqpInstancessub-parameter to define the topic for collectd metrics. The section name is a unique topic identifier for the cloud such ascloud1-telemetry. -
Set
CollectdSensubilityResultsChannelto define the topic for collectd-sensubility events. The value is a unique topic identifier for the cloud such assensubility/cloud1-telemetry.
-
|
When you define the topics for collectd and Ceilometer, the value you provide is transposed into the full topic that the Smart Gateway client uses to listen for messages. Ceilometer topic values are transposed into the topic address For an example of a cloud configuration in the |
Deploying the overcloud
Deploy or update the overcloud with the required environment files so that data is collected and transmitted to Service Telemetry Framework (STF).
-
Log in to the undercloud host as the
stackuser. -
Source the
stackrcundercloud credentials file:$ source ~/stackrc -
Add your data collection and Apache Qpid Dispatch Router environment files to the stack with your other environment files and deploy the overcloud:
(undercloud)$ openstack overcloud deploy --templates \ -e [your environment files] \ -e /usr/share/openstack-tripleo-heat-templates/environments/metrics/ceilometer-write-qdr.yaml \ -e /usr/share/openstack-tripleo-heat-templates/environments/metrics/qdr-edge-only.yaml \ -e /home/stack/enable-stf.yaml \ -e /home/stack/stf-connectors.yaml-
Include the
ceilometer-write-qdr.yamlfile to ensure that Ceilometer telemetry is sent to STF. -
Include the
qdr-edge-only.yamlfile to ensure that the message bus is enabled and connected to STF message bus routers. -
Include the
enable-stf.yamlenvironment file to ensure that the defaults are configured correctly. -
Include the
stf-connectors.yamlenvironment file to define the connection to STF.
-
Validating client-side installation
To validate data collection from the Service Telemetry Framework (STF) storage domain, query the data sources for delivered data. To validate individual nodes in the OpenStack (OSP) deployment, use SSH to connect to the console.
| Some telemetry data is available only when OSP has active workloads. |
-
Log in to an overcloud node, for example, controller-0.
-
Ensure that the
metrics_qdrand collection agent containers are running on the node:$ sudo podman container inspect --format '{{.State.Status}}' metrics_qdr collectd ceilometer_agent_notification ceilometer_agent_central running running running runningUse this command on compute nodes:
$ sudo podman container inspect --format '{{.State.Status}}' metrics_qdr collectd ceilometer_agent_compute -
Return the internal network address on which Apache Qpid Dispatch Router is running, for example,
172.17.1.44listening on port5666:$ sudo podman exec -it metrics_qdr cat /etc/qpid-dispatch/qdrouterd.conf listener { host: 172.17.1.44 port: 5666 authenticatePeer: no saslMechanisms: ANONYMOUS } -
Return a list of connections to the local Apache Qpid Dispatch Router:
$ sudo podman exec -it metrics_qdr qdstat --bus=172.17.1.44:5666 --connections

Connections
  id   host                                                                  container                                                                                                  role    dir  security                            authentication  tenant
  ============================================================================================================================================================================================================================================================================================
  1    default-interconnect-5671-service-telemetry.apps.infra.watch:443      default-interconnect-7458fd4d69-bgzfb                                                                      edge    out  TLSv1.2(DHE-RSA-AES256-GCM-SHA384)  anonymous-user
  12   172.17.1.44:60290                                                     openstack.org/om/container/controller-0/ceilometer-agent-notification/25/5c02cee550f143ec9ea030db5cccba14  normal  in   no-security                         no-auth
  16   172.17.1.44:36408                                                     metrics                                                                                                    normal  in   no-security                         anonymous-user
  899  172.17.1.44:39500                                                     10a2e99d-1b8a-4329-b48c-4335e5f75c84                                                                       normal  in   no-security                         no-auth
There are four connections:
-
Outbound connection to STF
-
Inbound connection from ceilometer
-
Inbound connection from collectd
-
Inbound connection from our
qdstatclientThe outbound STF connection is provided to the
MetricsQdrConnectorshost parameter and is the route for the STF storage domain. The other hosts are internal network addresses of the client connections to this Apache Qpid Dispatch Router.
-
-
To ensure that messages are delivered, list the links, and view the
_edgeaddress in thedelivcolumn for delivery of messages:$ sudo podman exec -it metrics_qdr qdstat --bus=172.17.1.44:5666 --links Router Links type dir conn id id peer class addr phs cap pri undel unsett deliv presett psdrop acc rej rel mod delay rate =========================================================================================================================================================== endpoint out 1 5 local _edge 250 0 0 0 2979926 0 0 0 0 2979926 0 0 0 endpoint in 1 6 250 0 0 0 0 0 0 0 0 0 0 0 0 endpoint in 1 7 250 0 0 0 0 0 0 0 0 0 0 0 0 endpoint out 1 8 250 0 0 0 0 0 0 0 0 0 0 0 0 endpoint in 1 9 250 0 0 0 0 0 0 0 0 0 0 0 0 endpoint out 1 10 250 0 0 0 911 911 0 0 0 0 0 911 0 endpoint in 1 11 250 0 0 0 0 911 0 0 0 0 0 0 0 endpoint out 12 32 local temp.lSY6Mcicol4J2Kp 250 0 0 0 0 0 0 0 0 0 0 0 0 endpoint in 16 41 250 0 0 0 2979924 0 0 0 0 2979924 0 0 0 endpoint in 912 1834 mobile $management 0 250 0 0 0 1 0 0 1 0 0 0 0 0 endpoint out 912 1835 local temp.9Ok2resI9tmt+CT 250 0 0 0 0 0 0 0 0 0 0 0 0 -
To list the addresses from OSP nodes to STF, connect to OpenShift to retrieve the Apache Qpid Dispatch Router pod name and list the connections. List the available Apache Qpid Dispatch Router pods:
$ oc get pods -l application=default-interconnect NAME READY STATUS RESTARTS AGE default-interconnect-7458fd4d69-bgzfb 1/1 Running 0 6d21h -
Connect to the pod and list the known connections. In this example, there are three
edgeconnections from the OSP nodes with connectionid22, 23, and 24:$ oc exec -it deploy/default-interconnect -- qdstat --connections 2020-04-21 18:25:47.243852 UTC default-interconnect-7458fd4d69-bgzfb Connections id host container role dir security authentication tenant last dlv uptime =============================================================================================================================================================================================== 5 10.129.0.110:48498 bridge-3f5 edge in no-security anonymous-user 000:00:00:02 000:17:36:29 6 10.129.0.111:43254 rcv[default-cloud1-ceil-meter-smartgateway-58f885c76d-xmxwn] edge in no-security anonymous-user 000:00:00:02 000:17:36:20 7 10.130.0.109:50518 rcv[default-cloud1-coll-event-smartgateway-58fbbd4485-rl9bd] normal in no-security anonymous-user - 000:17:36:11 8 10.130.0.110:33802 rcv[default-cloud1-ceil-event-smartgateway-6cfb65478c-g5q82] normal in no-security anonymous-user 000:01:26:18 000:17:36:05 22 10.128.0.1:51948 Router.ceph-0.redhat.local edge in TLSv1/SSLv3(DHE-RSA-AES256-GCM-SHA384) anonymous-user 000:00:00:03 000:22:08:43 23 10.128.0.1:51950 Router.compute-0.redhat.local edge in TLSv1/SSLv3(DHE-RSA-AES256-GCM-SHA384) anonymous-user 000:00:00:03 000:22:08:43 24 10.128.0.1:52082 Router.controller-0.redhat.local edge in TLSv1/SSLv3(DHE-RSA-AES256-GCM-SHA384) anonymous-user 000:00:00:00 000:22:08:34 27 127.0.0.1:42202 c2f541c1-4c97-4b37-a189-a396c08fb079 normal in no-security no-auth 000:00:00:00 000:00:00:00 -
To view the number of messages delivered by the network, use each address with the
oc execcommand:$ oc exec -it deploy/default-interconnect -- qdstat --address 2020-04-21 18:20:10.293258 UTC default-interconnect-7458fd4d69-bgzfb Router Addresses class addr phs distrib pri local remote in out thru fallback ========================================================================================================================== mobile anycast/ceilometer/event.sample 0 balanced - 1 0 970 970 0 0 mobile anycast/ceilometer/metering.sample 0 balanced - 1 0 2,344,833 2,344,833 0 0 mobile collectd/notify 0 multicast - 1 0 70 70 0 0 mobile collectd/telemetry 0 multicast - 1 0 216,128,890 216,128,890 0 0
Disabling OpenStack services used with Service Telemetry Framework
Disable the services used when deploying OpenStack (OSP) and connecting it to Service Telemetry Framework (STF). There is no removal of logs or generated configuration files as part of the disablement of the services.
-
Log in to the undercloud host as the
stackuser. -
Source the
stackrcundercloud credentials file:$ source ~/stackrc -
Create the
disable-stf.yamlenvironment file:$ cat > ~/disable-stf.yaml <<EOF --- resource_registry: OS::TripleO::Services::CeilometerAgentCentral: OS::Heat::None OS::TripleO::Services::CeilometerAgentNotification: OS::Heat::None OS::TripleO::Services::CeilometerAgentIpmi: OS::Heat::None OS::TripleO::Services::ComputeCeilometerAgent: OS::Heat::None OS::TripleO::Services::Redis: OS::Heat::None OS::TripleO::Services::Collectd: OS::Heat::None OS::TripleO::Services::MetricsQdr: OS::Heat::None EOF -
Remove the following files from your OSP TripleO deployment:
-
ceilometer-write-qdr.yaml -
qdr-edge-only.yaml -
enable-stf.yaml -
stf-connectors.yaml
-
-
Update the OSP overcloud. Ensure that you use the
disable-stf.yamlfile early in the list of environment files. By addingdisable-stf.yamlearly in the list, other environment files can override the configuration that would disable the service:(undercloud)$ openstack overcloud deploy --templates \ -e /home/stack/disable-stf.yaml \ -e [your environment files]
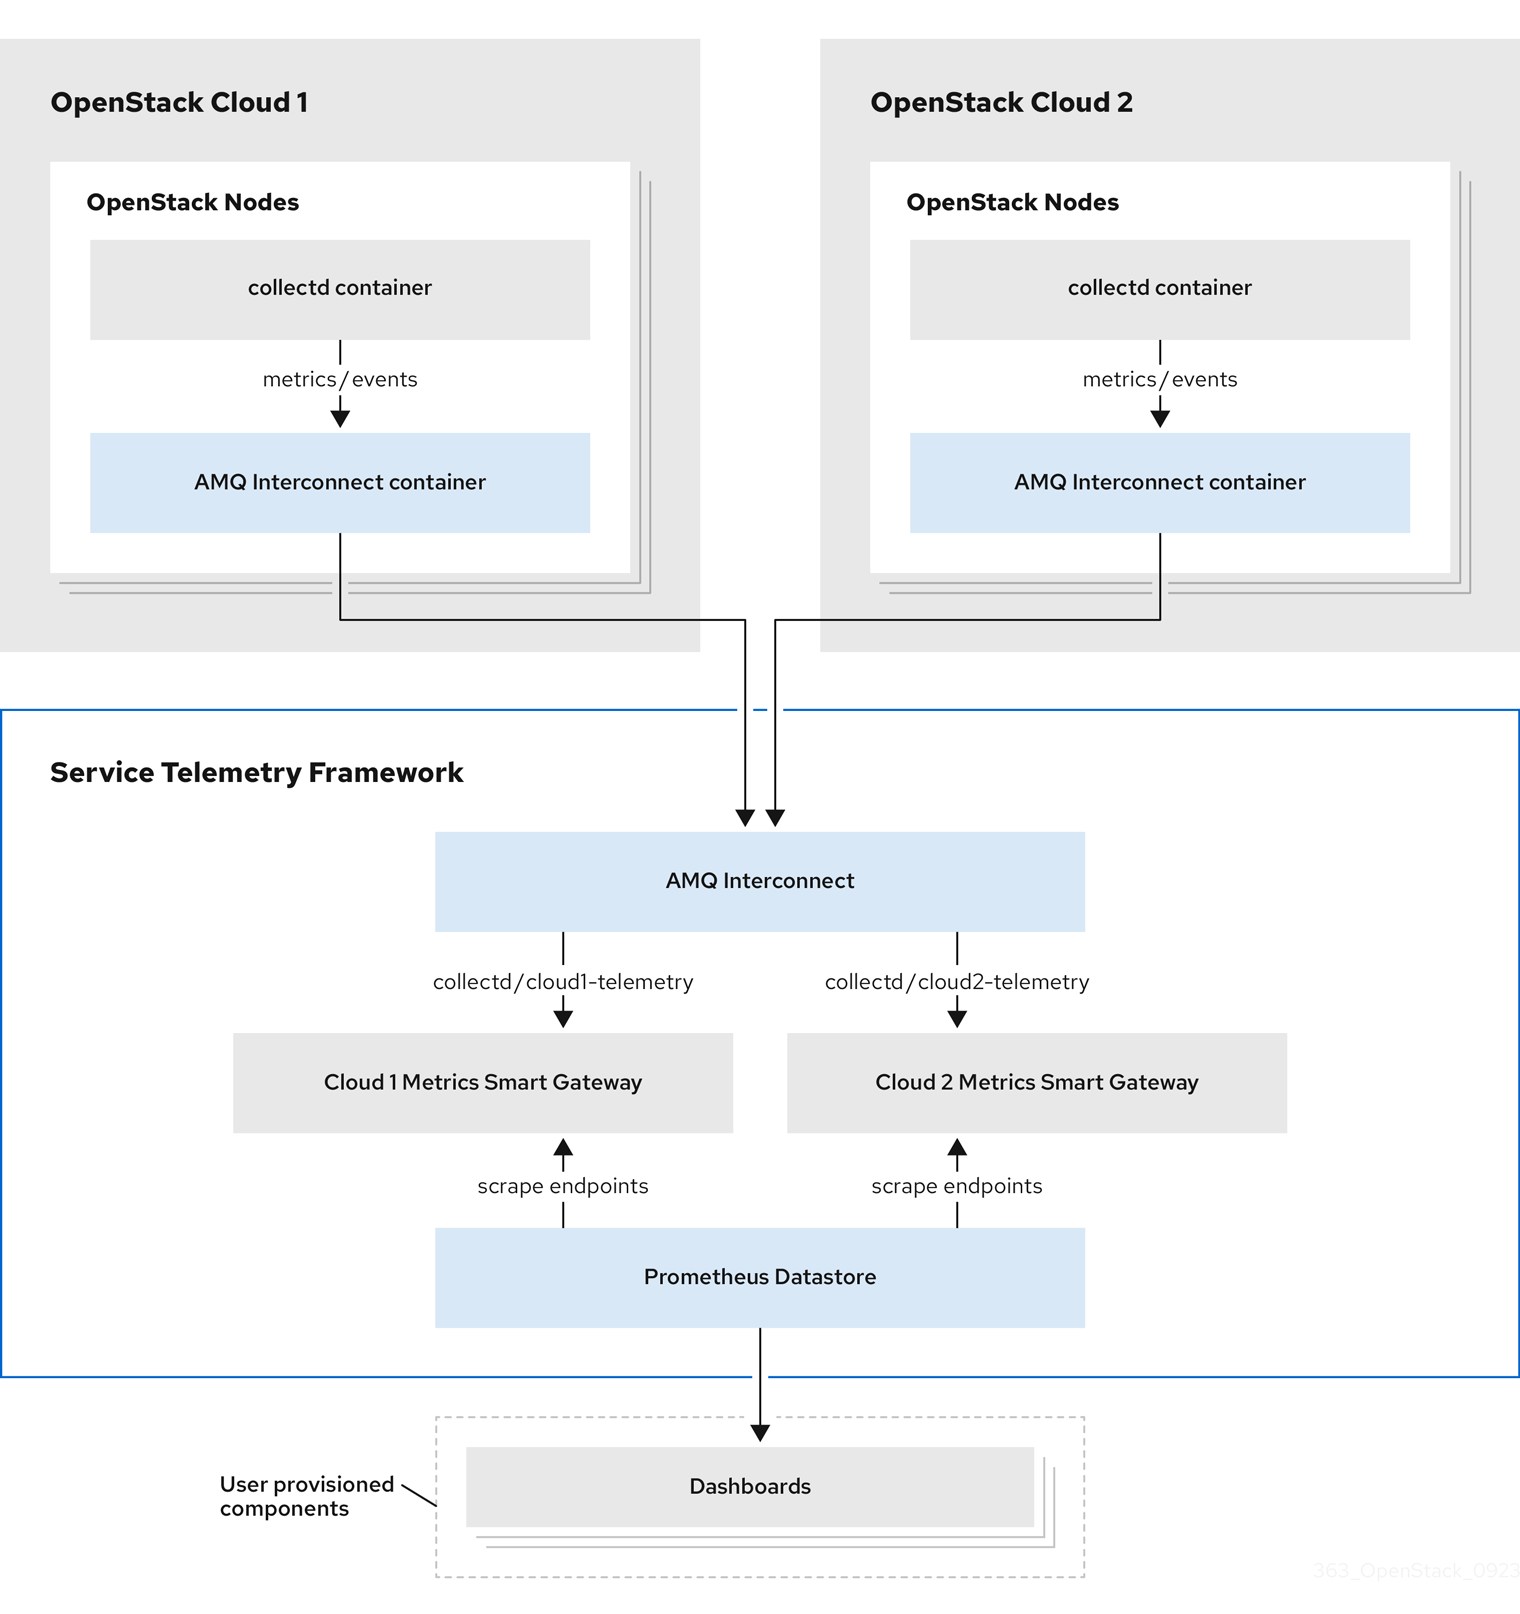
Configuring multiple clouds
You can configure multiple OpenStack (OSP) clouds to target a single instance of Service Telemetry Framework (STF). When you configure multiple clouds, every cloud must send metrics and events on their own unique message bus topic. In the STF deployment, Smart Gateway instances listen on these topics to save information to the common data store. Data that is stored by the Smart Gateway in the data storage domain is filtered by using the metadata that each of Smart Gateways creates.
|
Ensure that you deploy each cloud with a unique cloud domain configuration. For more information about configuring the domain for your cloud deployment, see Setting a unique cloud domain. |
To configure the OSP overcloud for a multiple cloud scenario, complete the following tasks:
-
Plan the AMQP address prefixes that you want to use for each cloud. For more information, see Planning AMQP address prefixes.
-
Deploy metrics and events consumer Smart Gateways for each cloud to listen on the corresponding address prefixes. For more information, see Deploying Smart Gateways.
-
Configure each cloud with a unique domain name. For more information, see Setting a unique cloud domain.
-
Create the base configuration for STF. For more information, see Creating the base configuration for STF.
-
Configure each cloud to send its metrics and events to STF on the correct address. For more information, see Creating the OpenStack environment file for multiple clouds.
Planning AMQP address prefixes
By default, OpenStack (OSP) nodes retrieve data through two data collectors; collectd and Ceilometer. The collectd-sensubility plugin requires a unique address. These components send telemetry data or notifications to the respective AMQP addresses, for example, collectd/telemetry. STF Smart Gateways listen on those AMQP addresses for data. To support multiple clouds and to identify which cloud generated the monitoring data, configure each cloud to send data to a unique address. Add a cloud identifier prefix to the second part of the address. The following list shows some example addresses and identifiers:
-
collectd/cloud1-telemetry -
collectd/cloud1-notify -
sensubility/cloud1-telemetry -
anycast/ceilometer/cloud1-metering.sample -
anycast/ceilometer/cloud1-event.sample -
collectd/cloud2-telemetry -
collectd/cloud2-notify -
sensubility/cloud2-telemetry -
anycast/ceilometer/cloud2-metering.sample -
anycast/ceilometer/cloud2-event.sample -
collectd/us-east-1-telemetry -
collectd/us-west-3-telemetry
Deploying Smart Gateways
You must deploy a Smart Gateway for each of the data collection types for each cloud; one for collectd metrics, one for collectd events, one for Ceilometer metrics, one for Ceilometer events, and one for collectd-sensubility metrics. Configure each of the Smart Gateways to listen on the AMQP address that you define for the corresponding cloud. To define Smart Gateways, configure the clouds parameter in the ServiceTelemetry manifest.
When you deploy STF for the first time, Smart Gateway manifests are created that define the initial Smart Gateways for a single cloud. When you deploy Smart Gateways for multiple cloud support, you deploy multiple Smart Gateways for each of the data collection types that handle the metrics and the events data for each cloud. The initial Smart Gateways are defined in cloud1 with the following subscription addresses:
collector |
type |
default subscription address |
collectd |
metrics |
collectd/telemetry |
collectd |
events |
collectd/notify |
collectd-sensubility |
metrics |
sensubility/telemetry |
Ceilometer |
metrics |
anycast/ceilometer/metering.sample |
Ceilometer |
events |
anycast/ceilometer/event.sample |
-
You have determined your cloud naming scheme. For more information about determining your naming scheme, see Planning AMQP address prefixes.
-
You have created your list of clouds objects. For more information about creating the content for the
cloudsparameter, see The clouds parameter.
-
Log in to OpenShift.
-
Change to the
service-telemetrynamespace:$ oc project service-telemetry -
Edit the
defaultServiceTelemetry object and add acloudsparameter with your configuration:Long cloud names might exceed the maximum pod name of 63 characters. Ensure that the combination of the
ServiceTelemetrynamedefaultand theclouds.namedoes not exceed 19 characters. Cloud names cannot contain any special characters, such as-. Limit cloud names to alphanumeric (a-z, 0-9).Topic addresses have no character limitation and can be different from the
clouds.namevalue.$ oc edit stf defaultapiVersion: infra.watch/v1beta1 kind: ServiceTelemetry metadata: ... spec: ... clouds: - name: cloud1 events: collectors: - collectorType: collectd subscriptionAddress: collectd/cloud1-notify - collectorType: ceilometer subscriptionAddress: anycast/ceilometer/cloud1-event.sample metrics: collectors: - collectorType: collectd subscriptionAddress: collectd/cloud1-telemetry - collectorType: sensubility subscriptionAddress: sensubility/cloud1-telemetry - collectorType: ceilometer subscriptionAddress: anycast/ceilometer/cloud1-metering.sample - name: cloud2 events: ... -
Save the ServiceTelemetry object.
-
Verify that each Smart Gateway is running. This can take several minutes depending on the number of Smart Gateways:
$ oc get po -l app=smart-gateway
NAME                                                      READY   STATUS    RESTARTS   AGE
default-cloud1-ceil-event-smartgateway-6cfb65478c-g5q82   2/2     Running   0          13h
default-cloud1-ceil-meter-smartgateway-58f885c76d-xmxwn   2/2     Running   0          13h
default-cloud1-coll-event-smartgateway-58fbbd4485-rl9bd   2/2     Running   0          13h
default-cloud1-coll-meter-smartgateway-7c6fc495c4-jn728   2/2     Running   0          13h
default-cloud1-sens-meter-smartgateway-8h4tc445a2-mm683   2/2     Running   0          13h
Deleting the default Smart Gateways
After you configure Service Telemetry Framework (STF) for multiple clouds, you can delete the default Smart Gateways if they are no longer in use. The Service Telemetry Operator can remove SmartGateway objects that were created but are no longer listed in the ServiceTelemetry clouds list of objects. To enable the removal of SmartGateway objects that are not defined by the clouds parameter, you must set the cloudsRemoveOnMissing parameter to true in the ServiceTelemetry manifest.
If you do not want to deploy any Smart Gateways, define an empty clouds list by using the clouds: [] parameter.
|
The cloudsRemoveOnMissing parameter is disabled by default. If you enable the cloudsRemoveOnMissing parameter, you remove any manually-created SmartGateway objects in the current namespace without any possibility to restore.
|
-
Define your
cloudsparameter with the list of cloud objects that you want the Service Telemetry Operator to manage. For more information, see The clouds parameter. -
Edit the ServiceTelemetry object and add the
cloudsRemoveOnMissingparameter:apiVersion: infra.watch/v1beta1 kind: ServiceTelemetry metadata: ... spec: ... cloudsRemoveOnMissing: true clouds: ... -
Save the modifications.
-
Verify that the Operator deleted the Smart Gateways. This can take several minutes while the Operators reconcile the changes:
$ oc get smartgateways
Setting a unique cloud domain
To ensure that telemetry from different OpenStack (OSP) clouds to Service Telemetry Framework (STF) can be uniquely identified and do not conflict, configure the CloudDomain parameter.
| Ensure that you do not change host or domain names in an existing deployment. Host and domain name configuration is supported in new cloud deployments only. |
-
Create a new environment file, for example,
hostnames.yaml. -
Set the
CloudDomainparameter in the environment file, as shown in the following example:hostnames.yamlparameter_defaults: CloudDomain: newyork-west-04 CephStorageHostnameFormat: 'ceph-%index%' ObjectStorageHostnameFormat: 'swift-%index%' ComputeHostnameFormat: 'compute-%index%' -
Add the new environment file to your deployment.
-
Core Overcloud Parameters in the Overcloud Parameters guide
Creating the OpenStack environment file for multiple clouds
To label traffic according to the cloud of origin, you must create a configuration with cloud-specific instance names. Create an stf-connectors.yaml file and adjust the values of CeilometerQdrMetricsConfig and CollectdAmqpInstances to match the AMQP address prefix scheme.
If you enabled container health and API status monitoring, you must also modify the CollectdSensubilityResultsChannel parameter. For more information, see OpenStack API status and containerized services health.
|
-
You have retrieved the CA certificate from the Apache Qpid Dispatch Router deployed by STF. For more information, see Getting CA certificate from Service Telemetry Framework for overcloud configuration.
-
You have created your list of clouds objects. For more information about creating the content for the clouds parameter, see the clouds configuration parameter.
-
You have retrieved the Apache Qpid Dispatch Router route address. For more information, see Retrieving the Apache Qpid Dispatch Router route address.
-
You have created the base configuration for STF. For more information, see Creating the base configuration for STF.
-
You have created a unique domain name environment file. For more information, see Setting a unique cloud domain.
-
Log in to the undercloud host as the
stackuser. -
Create a configuration file called
stf-connectors.yamlin the/home/stackdirectory. -
In the
stf-connectors.yamlfile, configure theMetricsQdrConnectorsaddress to connect to the Apache Qpid Dispatch Router on the overcloud deployment. Configure theCeilometerQdrMetricsConfig,CollectdAmqpInstances, andCollectdSensubilityResultsChanneltopic values to match the AMQP address that you want for this cloud deployment.stf-connectors.yamlresource_registry: OS::TripleO::Services::Collectd: /usr/share/openstack-tripleo-heat-templates/deployment/metrics/collectd-container-puppet.yaml parameter_defaults: ExtraConfig: qdr::router_id: %{::hostname}.cloud1 MetricsQdrConnectors: - host: default-interconnect-5671-service-telemetry.apps.infra.watch port: 443 role: edge verifyHostname: false sslProfile: sslProfile MetricsQdrSSLProfiles: - name: sslProfile caCertFileContent: | -----BEGIN CERTIFICATE----- <snip> -----END CERTIFICATE----- CeilometerQdrMetricsConfig: driver: amqp topic: cloud1-metering CollectdAmqpInstances: cloud1-telemetry: format: JSON presettle: false CollectdSensubilityResultsChannel: sensubility/cloud1-telemetry-
The
qdr::router_idconfiguration is to override the default value which uses the fully-qualified domain name (FQDN) of the host. In some cases the FQDN can result in a router ID length of greater than 61 characters which results in failed QDR connections. For deployments with shorter FQDN values this is not necessary. -
The
resource_registryconfiguration directly loads the collectd service because you do not include thecollectd-write-qdr.yamlenvironment file for multiple cloud deployments. -
Replace the
hostparameter with the value that you retrieved in Retrieving the Apache Qpid Dispatch Router route address. -
Replace the
caCertFileContentparameter with the contents retrieved in Getting CA certificate from Service Telemetry Framework for overcloud configuration. -
Replace the
hostsub-parameter ofMetricsQdrConnectorswith the value that you retrieved in Retrieving the Apache Qpid Dispatch Router route address. -
Set
topicvalue ofCeilometerQdrMetricsConfig.topicto define the topic for Ceilometer metrics. The value is a unique topic identifier for the cloud such ascloud1-metering. -
Set
CollectdAmqpInstancessub-parameter to define the topic for collectd metrics. The section name is a unique topic identifier for the cloud such ascloud1-telemetry. -
Set
CollectdSensubilityResultsChannelto define the topic for collectd-sensubility events. The value is a unique topic identifier for the cloud such assensubility/cloud1-telemetry.When you define the topics for collectd and Ceilometer, the value you provide is transposed into the full topic that the Smart Gateway client uses to listen for messages.
Ceilometer topic values are transposed into the topic address
anycast/ceilometer/<TOPIC>.sampleand collectd topic values are transposed into the topic addresscollectd/<TOPIC>. The value for sensubility is the full topic path and has no transposition from topic value to topic address.For an example of a cloud configuration in the
ServiceTelemetryobject referring to the full topic address, see The clouds parameter.
-
-
Ensure that the naming convention in the
stf-connectors.yamlfile aligns with thespec.bridge.amqpUrlfield in the Smart Gateway configuration. For example, configure theCeilometerQdrMetricsConfig.topicfield to a value ofcloud1-metering. -
Log in to the undercloud host as the
stackuser. -
Source the
stackrcundercloud credentials file:$ source stackrc -
Include the
stf-connectors.yamlfile and unique domain name environment filehostnames.yamlin theopenstack overcloud deploymentcommand, with any other environment files relevant to your environment:If you use the collectd-write-qdr.yamlfile with a customCollectdAmqpInstancesparameter, data publishes to the custom and default topics. In a multiple cloud environment, the configuration of theresource_registryparameter in thestf-connectors.yamlfile loads the collectd service.(undercloud)$ openstack overcloud deploy --templates \ -e [your environment files] \ -e /usr/share/openstack-tripleo-heat-templates/environments/metrics/ceilometer-write-qdr.yaml \ -e /usr/share/openstack-tripleo-heat-templates/environments/metrics/qdr-edge-only.yaml \ -e /home/stack/hostnames.yaml \ -e /home/stack/enable-stf.yaml \ -e /home/stack/stf-connectors.yaml -
Deploy the OpenStack overcloud.
-
For information about how to validate the deployment, see Validating client-side installation.
Querying metrics data from multiple clouds
Data stored in Prometheus has a service label according to the Smart Gateway it was scraped from. You can use this label to query data from a specific cloud.
To query data from a specific cloud, use a Prometheus promql query that matches the associated service label; for example: collectd_uptime{service="default-cloud1-coll-meter"}.
Using operational features of Service Telemetry Framework
You can use the following operational features to provide additional functionality to the Service Telemetry Framework (STF):
Dashboards in Service Telemetry Framework
Use the third-party application, Grafana, to visualize system-level metrics that the data collectors collectd and Ceilometer gather for each individual host node.
For more information about configuring data collectors, see Deploying OpenStack overcloud for Service Telemetry Framework using director.
You can use dashboards to monitor a cloud:
- Infrastructure dashboard
-
Use the infrastructure dashboard to view metrics for a single node at a time. Select a node from the upper left corner of the dashboard.
- Cloud view dashboard
-
Use the cloud view dashboard to view panels to monitor service resource usage, API stats, and cloud events. You must enable API health monitoring and service monitoring to provide the data for this dashboard. API health monitoring is enabled by default in the STF base configuration. For more information, see Creating the base configuration for STF.
-
For more information about API health monitoring, see OpenStack API status and containerized services health.
-
For more information about OSP service monitoring, see Resource usage of OpenStack services.
-
- Virtual machine view dashboard
-
Use the virtual machine view dashboard to view panels to monitor virtual machine infrastructure usage. Select a cloud and project from the upper left corner of the dashboard. You must enable event storage if you want to enable the event annotations on this dashboard. For more information, see Creating a ServiceTelemetry object in OpenShift.
- Memcached view dashboard
-
Use the memcached view dashboard to view panels to monitor connections, availability, system metrics and cache performance. Select a cloud from the upper left corner of the dashboard.
Configuring Grafana to host the dashboard
Grafana is not included in the default Service Telemetry Framework (STF) deployment, so you must deploy the Grafana Operator from community-operators CatalogSource. If you use the Service Telemetry Operator to deploy Grafana, it results in a Grafana instance and the configuration of the default data sources for the local STF deployment.
-
Log in to your OpenShift environment where STF is hosted.
-
Subscribe to the Grafana Operator by using the community-operators CatalogSource:
Community Operators are Operators which have not been vetted or verified by Red Hat. Community Operators should be used with caution because their stability is unknown. Red Hat provides no support for community Operators.
$ oc apply -f - <<EOF apiVersion: operators.coreos.com/v1alpha1 kind: Subscription metadata: labels: operators.coreos.com/grafana-operator.openshift-operators: "" name: grafana-operator namespace: openshift-operators spec: channel: v5 installPlanApproval: Automatic name: grafana-operator source: community-operators sourceNamespace: openshift-marketplace EOF -
Verify that the Operator launched successfully. In the command output, if the value of the
PHASEcolumn isSucceeded, the Operator launched successfully:$ oc wait --for jsonpath="{.status.phase}"=Succeeded csv --namespace openshift-operators -l operators.coreos.com/grafana-operator.openshift-operators clusterserviceversion.operators.coreos.com/grafana-operator.v5.6.0 condition met -
To launch a Grafana instance, create or modify the
ServiceTelemetryobject. Setgraphing.enabledandgraphing.grafana.ingressEnabledtotrue. Optionally, set the value ofgraphing.grafana.baseImageto the Grafana workload container image that will be deployed:$ oc edit stf default apiVersion: infra.watch/v1beta1 kind: ServiceTelemetry ... spec: ... graphing: enabled: true grafana: ingressEnabled: true baseImage: 'registry.redhat.io/rhel8/grafana:9' -
Verify that the Grafana instance deployed:
$ oc wait --for jsonpath="{.status.phase}"=Running pod -l app=default-grafana --timeout=600s pod/default-grafana-deployment-669968df64-wz5s2 condition met -
Verify that the Grafana data sources installed correctly:
$ oc get grafanadatasources.grafana.integreatly.org NAME NO MATCHING INSTANCES LAST RESYNC AGE default-ds-stf-prometheus 2m35s 2m56s -
Verify that the Grafana route exists:
$ oc get route default-grafana-route

NAME                    HOST/PORT                                                   PATH   SERVICES                  PORT   TERMINATION   WILDCARD
default-grafana-route   default-grafana-route-service-telemetry.apps.infra.watch           default-grafana-service   web    reencrypt     None
Enabling dashboards
The Grafana Operator can import and manage dashboards by creating GrafanaDashboard objects. Service Telemetry Operator can enable a set of default dashboards that create the GrafanaDashboard objects that load dashboards into the Grafana instance.
Set the value of graphing.grafana.dashboards.enabled to true to load the following dashboards into Grafana :
-
Infrastructure dashboard
-
Cloud view dashboard
-
Virtual machine view dashboard
-
Memcached view dashboard
You can use the GrafanaDashboard object to create and load additional dashboards into Grafana. For more information about managing dashboards with Grafana Operator, see Dashboards in the Grafana Operator project documentation.
-
You enabled graphing in the
ServiceTelemetryobject. For more information about graphing, see Configuring Grafana to host the dashboard.
-
To enable the managed dashboards, create or modify the
ServiceTelemetryobject. Setgraphing.grafana.dashboards.enabledtotrue:$ oc edit stf default apiVersion: infra.watch/v1beta1 kind: ServiceTelemetry ... spec: ... graphing: enabled: true grafana: dashboards: enabled: true -
Verify that the Grafana dashboards are created. The process of Service Telemetry Operator creating the dashboards might take some time.
$ oc get grafanadashboards.grafana.integreatly.org NAME NO MATCHING INSTANCES LAST RESYNC AGE memcached-dashboard-1 38s 38s rhos-cloud-dashboard-1 39s 39s rhos-dashboard-1 39s 39s virtual-machine-dashboard-1 37s 37s -
Retrieve the Grafana route address:
$ oc get route default-grafana-route -ojsonpath='{.spec.host}' default-grafana-route-service-telemetry.apps.infra.watch -
In a web browser, navigate to https://<grafana_route_address>. Replace <grafana_route_address> with the value that you retrieved in the previous step.
-
Log in with OpenShift credentials. For more information about logging in, see Accessing user interfaces for STF components.
-
To view the dashboard, click Dashboards and Browse. The managed dashboards are available in the service-telemetry folder.
Connecting an external dashboard system
It is possible to configure third-party visualization tools to connect to the STF Prometheus for metrics retrieval. Access is controlled via an OAuth token, and a ServiceAccount is already created that has (only) the required permissions. A new OAuth token can be generated against this account for the external system to use.
To use the authentication token, the third-party tool must be configured to supply an HTTP Bearer Token Authorization header as described in RFC6750. Consult the documentation of the third-party tool for how to configure this header. For example Configure Prometheus - Custom HTTP Headers in the Grafana Documentation.
-
Log in to OpenShift.
-
Change to the
service-telemetrynamespace:$ oc project service-telemetry -
Create a new token secret for the stf-prometheus-reader service account
$ oc create -f - <<EOF apiVersion: v1 kind: Secret metadata: name: my-prometheus-reader-token namespace: service-telemetry annotations: kubernetes.io/service-account.name: stf-prometheus-reader type: kubernetes.io/service-account-token EOF -
Retrieve the token from the secret
$ TOKEN=$(oc get secret my-prometheus-reader-token -o template='{{.data.token}}' | base64 -d) -
Retrieve the Prometheus host name
$ PROM_HOST=$(oc get route default-prometheus-proxy -ogo-template='{{ .spec.host }}') -
Test the access token
$ curl -k -H "Authorization: Bearer ${TOKEN}" https://${PROM_HOST}/api/v1/query?query=up {"status":"success",[...] -
Configure your third-party tool with the PROM_HOST and TOKEN values from above
$ echo $PROM_HOST $ echo $TOKEN -
The token remains valid as long as the secret exists. You can revoke the token by deleting the secret.
$ oc delete secret my-prometheus-reader-token
secret "my-prometheus-reader-token" deleted
For more information about service account token secrets, see Creating a service account token secret in the OpenShift Container Platform Documentation.
Metrics retention time period in Service Telemetry Framework
The default retention time for metrics stored in Service Telemetry Framework (STF) is 24 hours, which provides enough data for trends to develop for the purposes of alerting.
For long-term storage, use systems designed for long-term data retention, for example, Thanos.
-
To adjust STF for additional metrics retention time, see Editing the metrics retention time period in Service Telemetry Framework.
-
For recommendations about Prometheus data storage and estimating storage space, see https://prometheus.io/docs/prometheus/latest/storage/#operational-aspects
-
For more information about Thanos, see https://thanos.io/
Editing the metrics retention time period in Service Telemetry Framework
You can adjust Service Telemetry Framework (STF) for additional metrics retention time.
-
Log in to OpenShift.
-
Change to the service-telemetry namespace:
$ oc project service-telemetry -
Edit the ServiceTelemetry object:
$ oc edit stf default -
Add
retention: 7dto the storage section of backends.metrics.prometheus.storage to increase the retention period to seven days:If you set a long retention period, retrieving data from heavily populated Prometheus systems can result in queries returning results slowly. apiVersion: infra.watch/v1beta1 kind: ServiceTelemetry metadata: name: default namespace: service-telemetry spec: ... backends: metrics: prometheus: enabled: true storage: strategy: persistent retention: 7d ... -
Save your changes and close the object.
-
Wait for prometheus to restart with the new settings.
$ oc get po -l app.kubernetes.io/name=prometheus -w -
Verify the new retention setting by checking the command line arguments used in the pod.
$ oc describe po prometheus-default-0 | grep retention.time
      --storage.tsdb.retention.time=24h
-
For more information about the metrics retention time, see Metrics retention time period in Service Telemetry Framework.
Alerts in Service Telemetry Framework
You create alert rules in Prometheus and alert routes in Alertmanager. Alert rules in Prometheus servers send alerts to an Alertmanager, which manages the alerts. Alertmanager can silence, inhibit, or aggregate alerts, and send notifications by using email, on-call notification systems, or chat platforms.
To create an alert, complete the following tasks:
-
Create an alert rule in Prometheus. For more information, see Creating an alert rule in Prometheus.
-
Create an alert route in Alertmanager. There are two ways in which you can create an alert route:
For more information about alerts or notifications with Prometheus and Alertmanager, see https://prometheus.io/docs/alerting/overview/
To view an example set of alerts that you can use with Service Telemetry Framework (STF), see https://github.com/infrawatch/service-telemetry-operator/tree/master/deploy/alerts
Creating an alert rule in Prometheus
Prometheus evaluates alert rules to trigger notifications. If the rule condition returns an empty result set, the condition is false. Otherwise, the rule is true and it triggers an alert.
-
Log in to OpenShift.
-
Change to the
service-telemetrynamespace:$ oc project service-telemetry -
Create a
PrometheusRuleobject that contains the alert rule. The Prometheus Operator loads the rule into Prometheus:$ oc apply -f - <<EOF apiVersion: monitoring.rhobs/v1 kind: PrometheusRule metadata: creationTimestamp: null labels: prometheus: default role: alert-rules name: prometheus-alarm-rules namespace: service-telemetry spec: groups: - name: ./openstack.rules rules: - alert: Collectd metrics receive rate is zero expr: rate(sg_total_collectd_msg_received_count[1m]) == 0 EOFTo change the rule, edit the value of the
exprparameter. -
To verify that the Operator loaded the rules into Prometheus, run the
curlcommand against the default-prometheus-proxy route with basic authentication:$ curl -k -H "Authorization: Bearer $(oc create token stf-prometheus-reader)" https://$(oc get route default-prometheus-proxy -ogo-template='{{ .spec.host }}')/api/v1/rules {"status":"success","data":{"groups":[{"name":"./openstack.rules","file":"/etc/prometheus/rules/prometheus-default-rulefiles-0/service-telemetry-prometheus-alarm-rules.yaml","rules":[{"state":"inactive","name":"Collectd metrics receive count is zero","query":"rate(sg_total_collectd_msg_received_count[1m]) == 0","duration":0,"labels":{},"annotations":{},"alerts":[],"health":"ok","evaluationTime":0.00034627,"lastEvaluation":"2021-12-07T17:23:22.160448028Z","type":"alerting"}],"interval":30,"evaluationTime":0.000353787,"lastEvaluation":"2021-12-07T17:23:22.160444017Z"}]}}
-
For more information on alerting, see https://github.com/coreos/prometheus-operator/blob/master/Documentation/user-guides/alerting.md
Configuring custom alerts
You can add custom alerts to the PrometheusRule object that you created in Creating an alert rule in Prometheus.
-
Use the
oc editcommand:$ oc edit prometheusrules.monitoring.rhobs prometheus-alarm-rules -
Edit the
PrometheusRulesmanifest. -
Save and close the manifest.
-
For more information about how to configure alerting rules, see https://prometheus.io/docs/prometheus/latest/configuration/alerting_rules/.
-
For more information about PrometheusRules objects, see https://github.com/coreos/prometheus-operator/blob/master/Documentation/user-guides/alerting.md
Creating a standard alert route in Alertmanager
Use Alertmanager to deliver alerts to an external system, such as email, IRC, or other notification channel. The Prometheus Operator manages the Alertmanager configuration as a OpenShift secret. By default, Service Telemetry Framework (STF) deploys a basic configuration that results in no receivers:
alertmanager.yaml: |-
  global:
    resolve_timeout: 5m
  route:
    group_by: ['job']
    group_wait: 30s
    group_interval: 5m
    repeat_interval: 12h
    receiver: 'null'
  receivers:
  - name: 'null'
To deploy a custom Alertmanager route with STF, you must add a alertmanagerConfigManifest parameter to the Service Telemetry Operator that results in an updated secret, managed by the Prometheus Operator.
If your alertmanagerConfigManifest contains a custom template, for example, to construct the title and text of the sent alert, you must deploy the contents of the alertmanagerConfigManifest using a base64-encoded configuration. For more information, see Creating an alert route with templating in Alertmanager.
|
-
Log in to OpenShift.
-
Change to the
service-telemetrynamespace:$ oc project service-telemetry -
Edit the
ServiceTelemetryobject for your STF deployment:$ oc edit stf default -
Add the new parameter
alertmanagerConfigManifestand theSecretobject contents to define thealertmanager.yamlconfiguration for Alertmanager:This step loads the default template that the Service Telemetry Operator manages. To verify that the changes are populating correctly, change a value, return the alertmanager-defaultsecret, and verify that the new value is loaded into memory. For example, change the value of the parameterglobal.resolve_timeoutfrom5mto10m.apiVersion: infra.watch/v1beta1 kind: ServiceTelemetry metadata: name: default namespace: service-telemetry spec: backends: metrics: prometheus: enabled: true alertmanagerConfigManifest: | apiVersion: v1 kind: Secret metadata: name: 'alertmanager-default' namespace: 'service-telemetry' type: Opaque stringData: alertmanager.yaml: |- global: resolve_timeout: 10m route: group_by: ['job'] group_wait: 30s group_interval: 5m repeat_interval: 12h receiver: 'null' receivers: - name: 'null' -
Verify that the configuration has been applied to the secret:
$ oc get secret alertmanager-default -o go-template='{{index .data "alertmanager.yaml" | base64decode }}' global: resolve_timeout: 10m route: group_by: ['job'] group_wait: 30s group_interval: 5m repeat_interval: 12h receiver: 'null' receivers: - name: 'null' -
Run the
wgetcommand from the prometheus pod against thealertmanager-proxyservice to retrieve the status andconfigYAMLcontents, and verify that the supplied configuration matches the configuration in Alertmanager:$ oc exec -it prometheus-default-0 -c prometheus -- sh -c "wget --header \"Authorization: Bearer \$(cat /var/run/secrets/kubernetes.io/serviceaccount/token)\" https://default-alertmanager-proxy:9095/api/v1/status -q -O -" {"status":"success","data":{"configYAML":"...",...}} -
Verify that the
configYAMLfield contains the changes you expect.
-
For more information about the OpenShift secret and the Prometheus operator, see Prometheus user guide on alerting.
Creating an alert route with templating in Alertmanager
Use Alertmanager to deliver alerts to an external system, such as email, IRC, or other notification channel. The Prometheus Operator manages the Alertmanager configuration as a OpenShift secret. By default, Service Telemetry Framework (STF) deploys a basic configuration that results in no receivers:
alertmanager.yaml: |-
  global:
    resolve_timeout: 5m
  route:
    group_by: ['job']
    group_wait: 30s
    group_interval: 5m
    repeat_interval: 12h
    receiver: 'null'
  receivers:
  - name: 'null'
If the alertmanagerConfigManifest parameter contains a custom template, for example, to construct the title and text of the sent alert, you must deploy the contents of the alertmanagerConfigManifest by using a base64-encoded configuration.
-
Log in to OpenShift.
-
Change to the
service-telemetrynamespace:$ oc project service-telemetry -
Create the necessary alertmanager config in a file called alertmanager.yaml, for example:
$ cat > alertmanager.yaml <<EOF global: resolve_timeout: 10m slack_api_url: <slack_api_url> receivers: - name: slack slack_configs: - channel: #stf-alerts title: |- ... text: >- ... route: group_by: ['job'] group_wait: 30s group_interval: 5m repeat_interval: 12h receiver: 'slack' EOF -
Generate the config manifest and add it to the
ServiceTelemetryobject for your STF deployment:$ CONFIG_MANIFEST=$(oc create secret --dry-run=client generic alertmanager-default --from-file=alertmanager.yaml -o json) $ oc patch stf default --type=merge -p '{"spec":{"alertmanagerConfigManifest":'"$CONFIG_MANIFEST"'}}' -
Verify that the configuration has been applied to the secret:
There will be a short delay as the operators update each object $ oc get secret alertmanager-default -o go-template='{{index .data "alertmanager.yaml" | base64decode }}' global: resolve_timeout: 10m slack_api_url: <slack_api_url> receivers: - name: slack slack_configs: - channel: #stf-alerts title: |- ... text: >- ... route: group_by: ['job'] group_wait: 30s group_interval: 5m repeat_interval: 12h receiver: 'slack' -
Run the
wgetcommand from the prometheus pod against thealertmanager-proxyservice to retrieve the status andconfigYAMLcontents, and verify that the supplied configuration matches the configuration in Alertmanager:$ oc exec -it prometheus-default-0 -c prometheus -- /bin/sh -c "wget --header \"Authorization: Bearer \$(cat /var/run/secrets/kubernetes.io/serviceaccount/token)\" https://default-alertmanager-proxy:9095/api/v1/status -q -O -" {"status":"success","data":{"configYAML":"...",...}} -
Verify that the
configYAMLfield contains the changes you expect.
-
For more information about the OpenShift secret and the Prometheus operator, see Prometheus user guide on alerting.
Sending alerts as SNMP traps
To enable SNMP traps, modify the ServiceTelemetry object and configure the snmpTraps parameters. SNMP traps are sent using version 2c.
Configuration parameters for snmpTraps
The snmpTraps parameter contains the following sub-parameters for configuring the alert receiver:
- enabled
-
Set the value of this sub-parameter to true to enable the SNMP trap alert receiver. The default value is false.
- target
-
Target address to send SNMP traps. Value is a string. Default is
192.168.24.254. - port
-
Target port to send SNMP traps. Value is an integer. Default is
162. - community
-
Target community to send SNMP traps to. Value is a string. Default is
public. - retries
-
SNMP trap retry delivery limit. Value is an integer. Default is
5. - timeout
-
SNMP trap delivery timeout defined in seconds. Value is an integer. Default is
1. - alertOidLabel
-
Label name in the alert that defines the OID value to send the SNMP trap as. Value is a string. Default is
oid. - trapOidPrefix
-
SNMP trap OID prefix for variable bindings. Value is a string. Default is
1.3.6.1.4.1.50495.15. - trapDefaultOid
-
SNMP trap OID when no alert OID label has been specified with the alert. Value is a string. Default is
1.3.6.1.4.1.50495.15.1.2.1. - trapDefaultSeverity
-
SNMP trap severity when no alert severity has been set. Value is a string. Defaults to an empty string.
Configure the snmpTraps parameter as part of the alerting.alertmanager.receivers definition in the ServiceTelemetry object:
apiVersion: infra.watch/v1beta1
kind: ServiceTelemetry
metadata:
  name: default
  namespace: service-telemetry
spec:
  alerting:
    alertmanager:
      receivers:
        snmpTraps:
          alertOidLabel: oid
          community: public
          enabled: true
          port: 162
          retries: 5
          target: 192.168.25.254
          timeout: 1
          trapDefaultOid: 1.3.6.1.4.1.50495.15.1.2.1
          trapDefaultSeverity: ""
          trapOidPrefix: 1.3.6.1.4.1.50495.15
...
Overview of the MIB definition
Delivery of SNMP traps uses object identifier (OID) value 1.3.6.1.4.1.50495.15.1.2.1 by default. The management information base (MIB) schema is available at https://github.com/infrawatch/prometheus-webhook-snmp/blob/master/PROMETHEUS-ALERT-CEPH-MIB.txt.
The OID number is comprised of the following component values:
* The value 1.3.6.1.4.1 is a global OID defined for private enterprises.
* The next identifier 50495 is a private enterprise number assigned by IANA for the Ceph organization.
* The other values are child OIDs of the parent.
- 15
-
prometheus objects
- 15.1
-
prometheus alerts
- 15.1.2
-
prometheus alert traps
- 15.1.2.1
-
prometheus alert trap default
The prometheus alert trap default is an object comprised of several other sub-objects to OID 1.3.6.1.4.1.50495.15 which is defined by the alerting.alertmanager.receivers.snmpTraps.trapOidPrefix parameter:
- <trapOidPrefix>.1.1.1
-
alert name
- <trapOidPrefix>.1.1.2
-
status
- <trapOidPrefix>.1.1.3
-
severity
- <trapOidPrefix>.1.1.4
-
instance
- <trapOidPrefix>.1.1.5
-
job
- <trapOidPrefix>.1.1.6
-
description
- <trapOidPrefix>.1.1.7
-
labels
- <trapOidPrefix>.1.1.8
-
timestamp
- <trapOidPrefix>.1.1.9
-
rawdata
The following is example output from a simple SNMP trap receiver that outputs the received trap to the console:
  SNMPv2-MIB::snmpTrapOID.0 = OID: SNMPv2-SMI::enterprises.50495.15.1.2.1
  SNMPv2-SMI::enterprises.50495.15.1.1.1 = STRING: "TEST ALERT FROM PROMETHEUS PLEASE ACKNOWLEDGE"
  SNMPv2-SMI::enterprises.50495.15.1.1.2 = STRING: "firing"
  SNMPv2-SMI::enterprises.50495.15.1.1.3 = STRING: "warning"
  SNMPv2-SMI::enterprises.50495.15.1.1.4 = ""
  SNMPv2-SMI::enterprises.50495.15.1.1.5 = ""
  SNMPv2-SMI::enterprises.50495.15.1.1.6 = STRING: "TEST ALERT FROM "
  SNMPv2-SMI::enterprises.50495.15.1.1.7 = STRING: "{\"cluster\": \"TEST\", \"container\": \"sg-core\", \"endpoint\": \"prom-https\", \"prometheus\": \"service-telemetry/default\", \"service\": \"default-cloud1-coll-meter\", \"source\": \"SG\"}"
  SNMPv2-SMI::enterprises.50495.15.1.1.8 = Timeticks: (1676476389) 194 days, 0:52:43.89
  SNMPv2-SMI::enterprises.50495.15.1.1.9 = STRING: "{\"status\": \"firing\", \"labels\": {\"cluster\": \"TEST\", \"container\": \"sg-core\", \"endpoint\": \"prom-https\", \"prometheus\": \"service-telemetry/default\", \"service\": \"default-cloud1-coll-meter\", \"source\": \"SG\"}, \"annotations\": {\"action\": \"TESTING PLEASE ACKNOWLEDGE, NO FURTHER ACTION REQUIRED ONLY A TEST\"}, \"startsAt\": \"2023-02-15T15:53:09.109Z\", \"endsAt\": \"0001-01-01T00:00:00Z\", \"generatorURL\": \"http://prometheus-default-0:9090/graph?g0.expr=sg_total_collectd_msg_received_count+%3E+1&g0.tab=1\", \"fingerprint\": \"feefeb77c577a02f\"}"
Configuring SNMP traps
-
Ensure that you know the IP address or hostname of the SNMP trap receiver where you want to send the alerts to.
-
Log in to OpenShift.
-
Change to the
service-telemetrynamespace:$ oc project service-telemetry -
To enable SNMP traps, modify the
ServiceTelemetryobject:$ oc edit stf default -
Set the
alerting.alertmanager.receivers.snmpTrapsparameters:apiVersion: infra.watch/v1beta1 kind: ServiceTelemetry ... spec: ... alerting: alertmanager: receivers: snmpTraps: enabled: true target: 10.10.10.10 -
Ensure that you set the value of
targetto the IP address or hostname of the SNMP trap receiver.
For more information about available parameters for snmpTraps, see Configuration parameters for snmpTraps.
Creating alerts for SNMP traps
You can create alerts that are configured for delivery by SNMP traps by adding labels that are parsed by the prometheus-webhook-snmp middleware to define the trap information and delivered object identifiers (OID). Adding the oid or severity labels is only required if you need to change the default values for a particular alert definition.
When you set the oid label, the top-level SNMP trap OID changes, but the sub-OIDs remain defined by the global trapOidPrefix value plus the child OID values .1.1.1 through .1.1.9. For more information about the MIB definition, see Overview of the MIB definition.
|
-
Log in to OpenShift.
-
Change to the
service-telemetrynamespace:$ oc project service-telemetry -
Create a
PrometheusRuleobject that contains the alert rule and anoidlabel that contains the SNMP trap OID override value:$ oc apply -f - <<EOF apiVersion: monitoring.rhobs/v1 kind: PrometheusRule metadata: creationTimestamp: null labels: prometheus: default role: alert-rules name: prometheus-alarm-rules-snmp namespace: service-telemetry spec: groups: - name: ./openstack.rules rules: - alert: Collectd metrics receive rate is zero expr: rate(sg_total_collectd_msg_received_count[1m]) == 0 labels: oid: 1.3.6.1.4.1.50495.15.1.2.1 severity: critical EOF
For more information about configuring alerts, see Alerts in Service Telemetry Framework.
Configuring the duration for the TLS certificates
To configure the duration of the TLS certificates that you use for the Apache Qpid Dispatch Router connection in Service Telemetry Framework (STF),
modify the ServiceTelemetry object and configure the certificates parameter.
Configuration parameters for the TLS certificates
You can configure the duration of the certificate with the following sub-parameters of the certificates parameter:
- endpointCertDuration
-
The requested duration or lifetime of the endpoint Certificate. Minimum accepted duration is 1 hour. Value must be in units accepted by Go time.ParseDuration https://golang.org/pkg/time/#ParseDuration. The default value is
70080h. - caCertDuration
-
The requested duration or lifetime of the CA Certificate. Minimum accepted duration is 1 hour. Value must be in units accepted by Go time.ParseDuration https://golang.org/pkg/time/#ParseDuration. Default value is
70080h.
| The default duration of certificates is long, because you usually copy a subset of them in the OpenStack deployment when the certificates renew. For more information about the QDR CA Certificate renewal process, see Renewing the Apache Qpid Dispatch Router certificate. |
You can configure the certificates parameter for QDR that is part of the transports.qdr definition in the ServiceTelemetry object:
apiVersion: infra.watch/v1beta1
kind: ServiceTelemetry
metadata:
  name: default
  namespace: service-telemetry
spec:
...
  transports:
    ...
    qdr:
      enabled: true
      certificates:
        endpointCertDuration: 70080h
        caCertDuration: 70080h
...
Configuring TLS certificates duration
To configure the duration of the TLS certificates to use with Service Telemetry Framework (STF), modify the ServiceTelemetry object and configure the certificates parameter.
-
You didn’t deploy an instance of Service Telemetry Operator already.
When you create the ServiceTelemetry object, the required certificates and their secrets for STF are also created.
For more information about how to modify the certificates and the secrets, see: Renewing the Apache Qpid Dispatch Router certificate.
The following procedure is valid for new STF deployments.
|
-
To edit the duration of the TLS certificate, you can set the QDR
caCertDuration, for example87600hfor 10 years:$ oc apply -f - <<EOF apiVersion: infra.watch/v1beta1 kind: ServiceTelemetry metadata: name: default namespace: service-telemetry spec: transport: qdr: enabled: true certificates: caCertDuration: 87600h EOF
-
Verify that the expiry date for the certificate is correct:
$ oc get secret  default-interconnect-selfsigned -o jsonpath='{.data.tls\.crt}' | base64 -d  | openssl x509 -in - -text | grep "Not After"
            Not After : Mar  9 21:00:16 2033 GMT
High availability
|
STF high availability (HA) mode is deprecated and is not supported in production environments. OpenShift is a highly-available platform, and you can cause issues and complicate debugging in STF if you enable HA mode. |
With high availability, Service Telemetry Framework (STF) can rapidly recover from failures in its component services. Although OpenShift restarts a failed pod if nodes are available to schedule the workload, this recovery process might take more than one minute, during which time events and metrics are lost. A high availability configuration includes multiple copies of STF components, which reduces recovery time to approximately 2 seconds. To protect against failure of an OpenShift node, deploy STF to an OpenShift cluster with three or more nodes.
Enabling high availability has the following effects:
-
The following components run two pods instead of the default one:
-
Apache Qpid Dispatch Router
-
Alertmanager
-
Prometheus
-
Events Smart Gateway
-
Metrics Smart Gateway
-
-
Recovery time from a lost pod in any of these services reduces to approximately 2 seconds.
Configuring high availability
To configure Service Telemetry Framework (STF) for high availability, add highAvailability.enabled: true to the ServiceTelemetry object in OpenShift. You can set this parameter at installation time or, if you already deployed STF, complete the following steps:
-
Log in to OpenShift.
-
Change to the
service-telemetrynamespace:$ oc project service-telemetry -
Use the oc command to edit the ServiceTelemetry object:
$ oc edit stf default -
Add
highAvailability.enabled: trueto thespecsection:apiVersion: infra.watch/v1beta1 kind: ServiceTelemetry ... spec: ... highAvailability: enabled: true -
Save your changes and close the object.
Observability Strategy in Service Telemetry Framework
Service Telemetry Framework (STF) does not include event storage backends or dashboarding tools. STF can optionally create datasource configurations for Grafana using the community operator to provide a dashboarding interface.
Instead of having Service Telemetry Operator create custom resource requests, you can use your own deployments of these applications or other compatible applications, and scrape the metrics Smart Gateways for delivery to your own Prometheus-compatible system for telemetry storage. If you set the observabilityStrategy to none, then storage backends will not be deployed so persistent storage will not be required by STF.
Use the observabilityStrategy property on the STF object to specify which type of observability components will be deployed.
The following values are available:
| value | meaning |
|---|---|
use_redhat |
Red Hat supported components are requested by STF. This includes Prometheus and Alertmanager from the Observability Operator, but no resource requests to Elastic Cloud on Kubernetes (ECK) Operator. If enabled, resources are also requested from the Grafana Operator (community component). |
use_hybrid |
In addition to the Red Hat supported components, Elasticsearch and Grafana resources are also requested (if specified in the ServiceTelemetry object) |
use_community |
The community version of Prometheus Operator is used instead of Observability Operator. Elasticsearch and Grafana resources are also requested (if specified in the ServiceTelemetry object) |
none |
No storage or alerting components are deployed |
|
Newly deployed STF environments as of 1.5.3 default to |
To migrate an existing STF deployment to use_redhat, see the Red Hat Knowledge Base article Migrating Service Telemetry Framework to fully supported operators.
Configuring an alternate observability strategy
To skip the deployment of storage, visualization, and alerting backends, add observabilityStrategy: none to the ServiceTelemetry spec. In this mode, you only deploy Apache Qpid Dispatch Router routers and Smart Gateways, and you must configure an external Prometheus-compatible system to collect metrics from the STF Smart Gateways, and an external Elasticsearch to receive the forwarded events.
-
Create a
ServiceTelemetryobject with the propertyobservabilityStrategy: nonein thespecparameter. The manifest shows results in a default deployment of STF that is suitable for receiving telemetry from a single cloud with all metrics collector types.$ oc apply -f - <<EOF apiVersion: infra.watch/v1beta1 kind: ServiceTelemetry metadata: name: default namespace: service-telemetry spec: observabilityStrategy: none EOF -
Delete the remaining objects that are managed by community operators
$ for o in alertmanagers.monitoring.rhobs/default prometheuses.monitoring.rhobs/default elasticsearch/elasticsearch grafana/default-grafana; do oc delete $o; done -
To verify that all workloads are operating correctly, view the pods and the status of each pod:
$ oc get pods
NAME                                                      READY   STATUS    RESTARTS   AGE
default-cloud1-ceil-event-smartgateway-6f8547df6c-p2db5   3/3     Running   0          132m
default-cloud1-ceil-meter-smartgateway-59c845d65b-gzhcs   3/3     Running   0          132m
default-cloud1-coll-event-smartgateway-bf859f8d77-tzb66   3/3     Running   0          132m
default-cloud1-coll-meter-smartgateway-75bbd948b9-d5phm   3/3     Running   0          132m
default-cloud1-sens-meter-smartgateway-7fdbb57b6d-dh2g9   3/3     Running   0          132m
default-interconnect-668d5bbcd6-57b2l                     1/1     Running   0          132m
interconnect-operator-b8f5bb647-tlp5t                     1/1     Running   0          47h
service-telemetry-operator-566b9dd695-wkvjq               1/1     Running   0          156m
smart-gateway-operator-58d77dcf7-6xsq7                    1/1     Running   0          47h
-
For more information about configuring additional clouds or to change the set of supported collectors, see Deploying Smart Gateways.
-
To migrate an existing STF deployment to
use_redhat, see the Red Hat Knowledge Base article Migrating Service Telemetry Framework to fully supported operators.
Configuring openshift-monitoring to consume metrics from STF
You can configure openshift-monitoring to consume metrics from STF so that you can use the existing Prometheus deployment for STF data. This configuration is useful in combination with observabilityStrategy: none as an alternative to the community operators. You must add a label to the namespace where STF is deployed, and create ServiceMonitor objects for each Smart Gateway intended to be scraped.
-
Edit the namespace object:
$ oc edit namespace service-telemetry -
Add the
openshift.io/cluster-monitoring: "true"label under themetadataproperty:metadata: labels: openshift.io/cluster-monitoring: "true" -
Create a ServiceMonitor object for each Smart Gateway:
$ for collector_type in ceil coll sens; do oc apply -f <(sed -e "s/<<COLLECTOR_TYPE>>/${collector_type}/g" << EOF apiVersion: monitoring.coreos.com/v1 kind: ServiceMonitor metadata: labels: app: smart-gateway name: default-cloud1-<<COLLECTOR_TYPE>>-meter namespace: service-telemetry spec: endpoints: - bearerTokenFile: /var/run/secrets/kubernetes.io/serviceaccount/token interval: 10s metricRelabelings: - action: labeldrop regex: pod - action: labeldrop regex: namespace - action: labeldrop regex: instance - action: labeldrop regex: job - action: labeldrop regex: publisher port: prom-https scheme: https tlsConfig: caFile: /etc/prometheus/configmaps/serving-certs-ca-bundle/service-ca.crt serverName: default-cloud1-<<COLLECTOR_TYPE>>-meter.service-telemetry.svc namespaceSelector: matchNames: - service-telemetry selector: matchLabels: app: smart-gateway smart-gateway: default-cloud1-<<COLLECTOR_TYPE>>-meter EOF ); done servicemonitor.monitoring.coreos.com/default-cloud1-ceil-meter configured servicemonitor.monitoring.coreos.com/default-cloud1-coll-meter configured servicemonitor.monitoring.coreos.com/default-cloud1-sens-meter configured -
To verify the successful configuration of openshift-monitoring, ensure that Smart Gateway metrics appear in Prometheus.
-
Retrieve the route for the openshift-monitoring prometheus:
$ oc get route -n openshift-monitoring prometheus-k8s NAME HOST/PORT PATH SERVICES PORT TERMINATION WILDCARD prometheus-k8s prometheus-k8s-openshift-monitoring.apps.infra.watch prometheus-k8s web reencrypt/Redirect None -
Visit the host in your browser and log in with OpenShift credentials.
-
Verify that the following targets are visible under the
Status -> Targetstab:-
service-telemetry/default-cloud1-ceil-meter/0
-
service-telemetry/default-cloud1-coll-meter/0
-
service-telemetry/default-cloud1-sens-meter/0
If there are problems with the configuration, find them on this page.
-
-
Issue the following queries on the
Graphtab:-
sg_total_collectd_metric_decode_count -
sg_total_ceilometer_metric_decode_count -
sg_total_sensubility_metric_decode_count
-
-
There should be one result from each Smart Gateway, as shown in the following example:
If the values returned are 0, it means that STF is not receiving that type of metric yet but as long as a result is returned, the configuration of openshift-monitoring is correct. -
sg_total_collectd_metric_decode_count{container="sg-core", endpoint="prom-https", service="default-cloud1-coll-meter", source="SG"} -
sg_total_ceilometer_metric_decode_count{container="sg-core", endpoint="prom-https", service="default-cloud1-ceil-meter", source="SG"} -
sg_total_sensubility_metric_decode_count{container="sg-core", endpoint="prom-https", service="default-cloud1-sens-meter", source="SG"}
-
Resource usage of OpenStack services
You can monitor the resource usage of the OpenStack (OSP) services, such as the APIs and other infrastructure processes, to identify bottlenecks in the overcloud by showing services that run out of compute power. Resource usage monitoring is enabled by default.
-
To disable resource usage monitoring, see Disabling resource usage monitoring of OpenStack services.
Disabling resource usage monitoring of OpenStack services
To disable the monitoring of OSP containerized service resource usage, you must set the CollectdEnableLibpodstats parameter to false.
-
You have created the
stf-connectors.yamlfile. For more information, see Deploying OpenStack overcloud for Service Telemetry Framework using director. -
You are using the most current version of OpenStack (OSP) Wallaby.
-
Open the
stf-connectors.yamlfile and add theCollectdEnableLibpodstatsparameter to override the setting inenable-stf.yaml. Ensure thatstf-connectors.yamlis called from theopenstack overcloud deploycommand afterenable-stf.yaml:CollectdEnableLibpodstats: false -
Continue with the overcloud deployment procedure. For more information, see Deploying the overcloud.
OpenStack API status and containerized services health
You can use the OCI (Open Container Initiative) standard to assess the container health status of each OpenStack (OSP) service by periodically running a health check script. Most OSP services implement a health check that logs issues and returns a binary status. For the OSP APIs, the health checks query the root endpoint and determine the health based on the response time.
Monitoring of OSP container health and API status is enabled by default.
-
To disable OSP container health and API status monitoring, see Disabling container health and API status monitoring.
Disabling container health and API status monitoring
To disable OSP containerized service health and API status monitoring, you must set the CollectdEnableSensubility parameter to false.
-
You have created the
stf-connectors.yamlfile in your templates directory. For more information, see Deploying OpenStack overcloud for Service Telemetry Framework using director. -
You are using the most current version of OpenStack (OSP) Wallaby.
-
Open the
stf-connectors.yamland add theCollectdEnableSensubilityparameter to override the setting inenable-stf.yaml. Ensure thatstf-connectors.yamlis called from theopenstack overcloud deploycommand afterenable-stf.yaml:CollectdEnableSensubility: false -
Continue with the overcloud deployment procedure. For more information, see Deploying the overcloud.
-
For more information about multiple cloud addresses, see Configuring multiple clouds.
Renewing the Apache Qpid Dispatch Router certificate
Periodically, you must renew the CA certificate that secures the Apache Qpid Dispatch Router connection between OpenStack (OSP) and Service Telemetry Framework (STF) when the certificate expires. The renewal is handled automatically by the cert-manager component in OpenShift, but you must manually copy the renewed certificate to your OSP nodes.
Checking for an expired Apache Qpid Dispatch Router CA certificate
When the CA certificate expires, the Apache Qpid Dispatch Router connections remain up, but cannot reconnect if they are interrupted. Eventually, some or all of the connections from your OpenStack (OSP) dispatch routers fail, showing errors on both sides, and the expiry or Not After field in your CA certificate is in the past.
-
Log in to OpenShift.
-
Change to the
service-telemetrynamespace:$ oc project service-telemetry -
Verify that some or all dispatch router connections have failed:
$ oc exec -it deploy/default-interconnect -- qdstat --connections | grep Router | wc 0 0 0 -
Check for this error in the OpenShift-hosted Apache Qpid Dispatch Router logs:
$ oc logs -l application=default-interconnect | tail [...] 2022-11-10 20:51:22.863466 +0000 SERVER (info) [C261] Connection from 10.10.10.10:34570 (to 0.0.0.0:5671) failed: amqp:connection:framing-error SSL Failure: error:140940E5:SSL routines:ssl3_read_bytes:ssl handshake failure -
Log into your OSP undercloud.
-
Check for this error in the OSP-hosted Apache Qpid Dispatch Router logs of a node with a failed connection:
$ ssh controller-0.ctlplane -- sudo tail /var/log/containers/metrics_qdr/metrics_qdr.log [...] 2022-11-10 20:50:44.311646 +0000 SERVER (info) [C137] Connection to default-interconnect-5671-service-telemetry.apps.mycluster.com:443 failed: amqp:connection:framing-error SSL Failure: error:0A000086:SSL routines::certificate verify failed -
Confirm that the CA certificate has expired by examining the file on an OSP node:
$ ssh controller-0.ctlplane -- cat /var/lib/config-data/puppet-generated/metrics_qdr/etc/pki/tls/certs/CA_sslProfile.pem | openssl x509 -text | grep "Not After"
            Not After : Nov 10 20:31:16 2022 GMT

$ date
Mon Nov 14 11:10:40 EST 2022
Updating the Apache Qpid Dispatch Router CA certificate
To update the Apache Qpid Dispatch Router certificate, you must export it from OpenShift and copy it to your OpenStack (OSP) nodes.
-
Log in to OpenShift.
-
Change to the
service-telemetrynamespace:$ oc project service-telemetry -
Export the CA certificate to
STFCA.pem:$ oc get secret/default-interconnect-selfsigned -o jsonpath='{.data.ca\.crt}' | base64 -d > STFCA.pem -
Copy
STFCA.pemto your OSP undercloud. -
Log into your OSP undercloud.
-
Edit the
stf-connectors.yamlfile to contain the new caCertFileContent. For more information, see Configuring the STF connection for the overcloud. -
Copy the
STFCA.pemfile to each OSP overcloud node:[stack@undercloud-0 ~]$ ansible -i overcloud-deploy/overcloud/tripleo-ansible-inventory.yaml allovercloud -b -m copy -a "src=STFCA.pem dest=/var/lib/config-data/puppet-generated/metrics_qdr/etc/pki/tls/certs/CA_sslProfile.pem" -
Restart the metrics_qdr container on each OSP overcloud node:
[stack@undercloud-0 ~]$ ansible -i overcloud-deploy/overcloud/tripleo-ansible-inventory.yaml allovercloud -m shell -a "sudo podman restart metrics_qdr"You do not need to deploy the overcloud after you copy the STFCA.pemfile and restart themetrics_qdrcontainer. You edit thestf-connectors.yamlfile so that future deployments do not overwrite the new CA certificate.
Removing Service Telemetry Framework from the OpenShift environment
Remove Service Telemetry Framework (STF) from an OpenShift environment if you no longer require the STF functionality.
To remove STF from the OpenShift environment, you must perform the following tasks:
-
Delete the namespace.
-
Remove the catalog source.
-
Remove the cert-manager Operator.
-
Remove the Observability Operator.
Deleting the namespace
To remove the operational resources for STF from OpenShift, delete the namespace.
-
Run the
oc deletecommand:$ oc delete project service-telemetry -
Verify that the resources have been deleted from the namespace:
$ oc get all
No resources found.
Removing the CatalogSource
If you do not expect to install Service Telemetry Framework (STF) again, delete the CatalogSource. When you remove the CatalogSource, PackageManifests related to STF are automatically removed from the Operator Lifecycle Manager catalog.
-
Delete the CatalogSource:
$ oc delete --namespace=openshift-marketplace catalogsource infrawatch-operators catalogsource.operators.coreos.com "infrawatch-operators" deleted -
Verify that the STF PackageManifests are removed from the platform. If successful, the following command returns no result:
$ oc get packagemanifests | grep InfraWatch
For more information about the OperatorHub.io Community Catalog Source, see Deploying Service Telemetry Framework to the OpenShift environment.
Removing the cert-manager Operator for Red Hat OpenShift
If you are not using the cert-manager Operator for Red Hat OpenShift for any other applications, delete the Subscription, ClusterServiceVersion, and CustomResourceDefinitions.
For more information about removing the cert-manager for Red Hat OpenShift Operator, see Removing cert-manager Operator for Red Hat OpenShift in the OpenShift Container Platform Documentation.
Removing the Observability Operator
If you are not using the Observability Operator for any other applications, delete the Subscription, ClusterServiceVersion, and CustomResourceDefinitions.
For more information about removing the Observability Operator, see Uninstalling the Cluster Observability Operator using the web console in the OpenShift Container Platform Documentation.